Product Hunt: The Ultimate Guide to Statistics of Projects
Recently, our Popsters project ended up at the Product Hunt’s Home feed. It’s hard to say it was a mega-successful launch but it undoubtedly gave us a lot of useful feedback, ideas and traffic.
After some time from the publication, this idea came up – why wouldn’t we conduct a research on the projects represented on the platform, similar to those our tool’s users conduct on social media pages.
A two weeks ago The Next Web published common conclusions of that article. And there we present our full research on activities at Product Hunt: engagement statistics data versus various parameters – publication time, subject, specific content and other product features. As a bonus, in the end we show statistics on which products are still ongoing/supported and which are not.
Research method
The activity data for various products were gathered via Product Hunt’s API as of August 8, 2017. The product operability data were updated on October 15.
The total of 32,657 projects have been analyzed, which appeared in the PH Home feed from the launch time (November 24, 2013).
The ranking of projects on Product Hunt is influenced by many factors. The factors we took into account are: date and time of publication, product card images count, video availability, tags and their count, hunter, upvotes count, relative activity for products (their position in the Top).
The research did not reveal any clear correlation between the product’s comments count and its position in the Top, therefore this factor was not taken into account.
Since different dates always saw different numbers of projects published, it appeared impossible to compare them by position in the Top. To evaluate the project’s proximity to Top 1, we calculated the relative % of the gained engagement in relation to the day’s leader from the equation:
Project N’s relative percentage for the day = (Project N’s upvotes count) / (Top 1 Project’s upvotes count for the day) * 100 %
This value basically tells us how close each project was to Top 1.
To evaluate the project’s viability status, we parsed the websites of all the published products (mobile apps and other products published on third-party platforms were not taken into account) and filtered out those with errors in the site’s response (500, 404, etc.), outdated SSL, redirection to hosting or parking services, “project closed” messages, and also outdated footer (2014 or 2015 as the earliest qualifying date). Those remained were additionally filtered based on the traffic data from SimilarWeb: we screened out the projects which had the supposed visits count below 5000.
All the calculation were done for Pacific Standard Time.
Results
Activity vs. Time of Publication
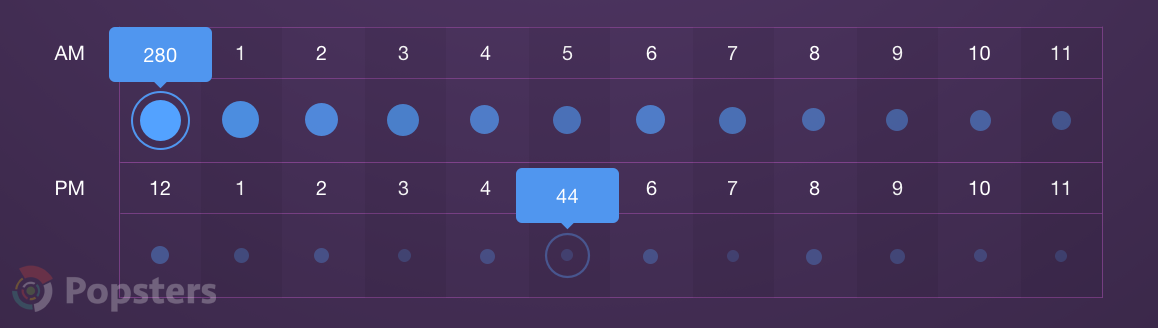
Average upvotes count vs. time of publication
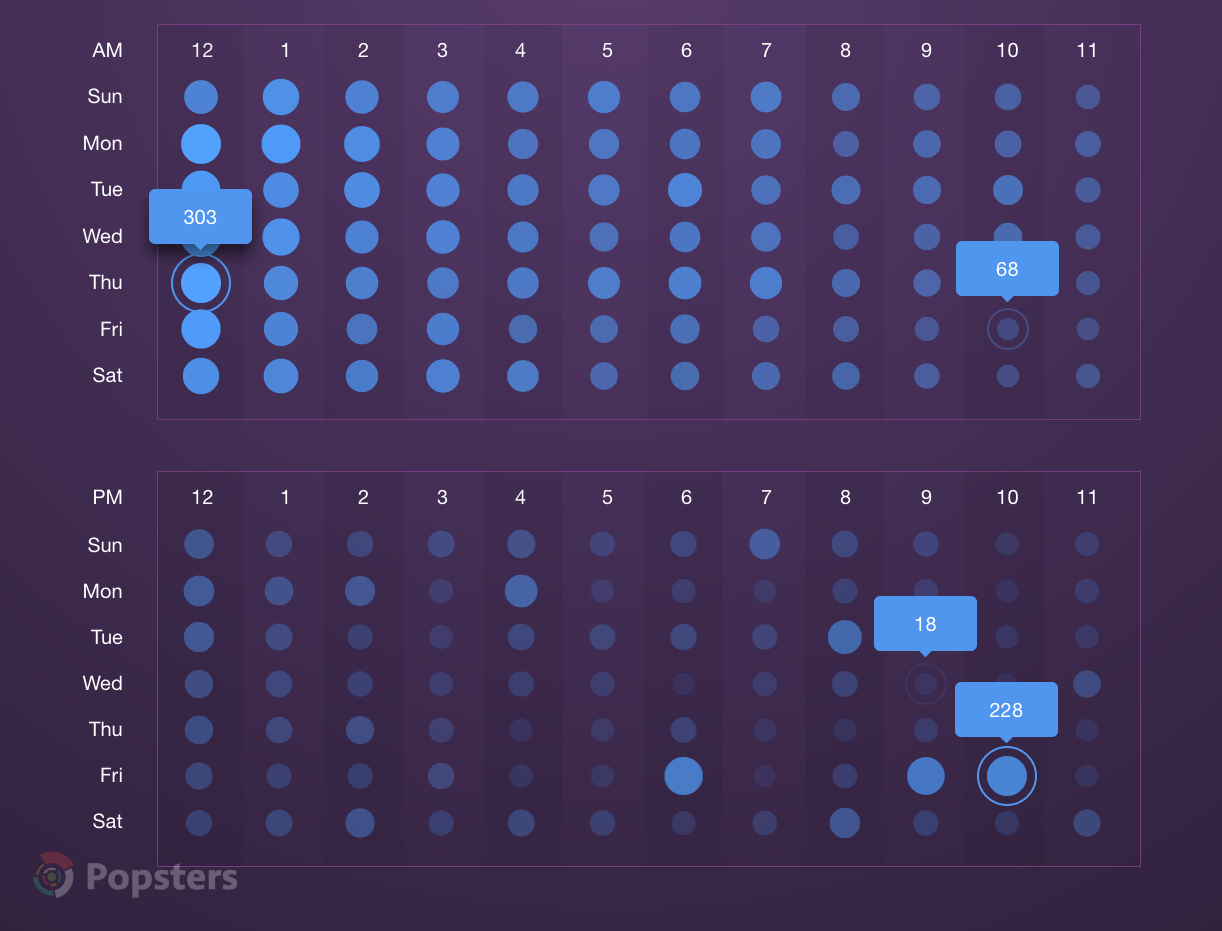
Average relative activity (%) vs. time of publication, %
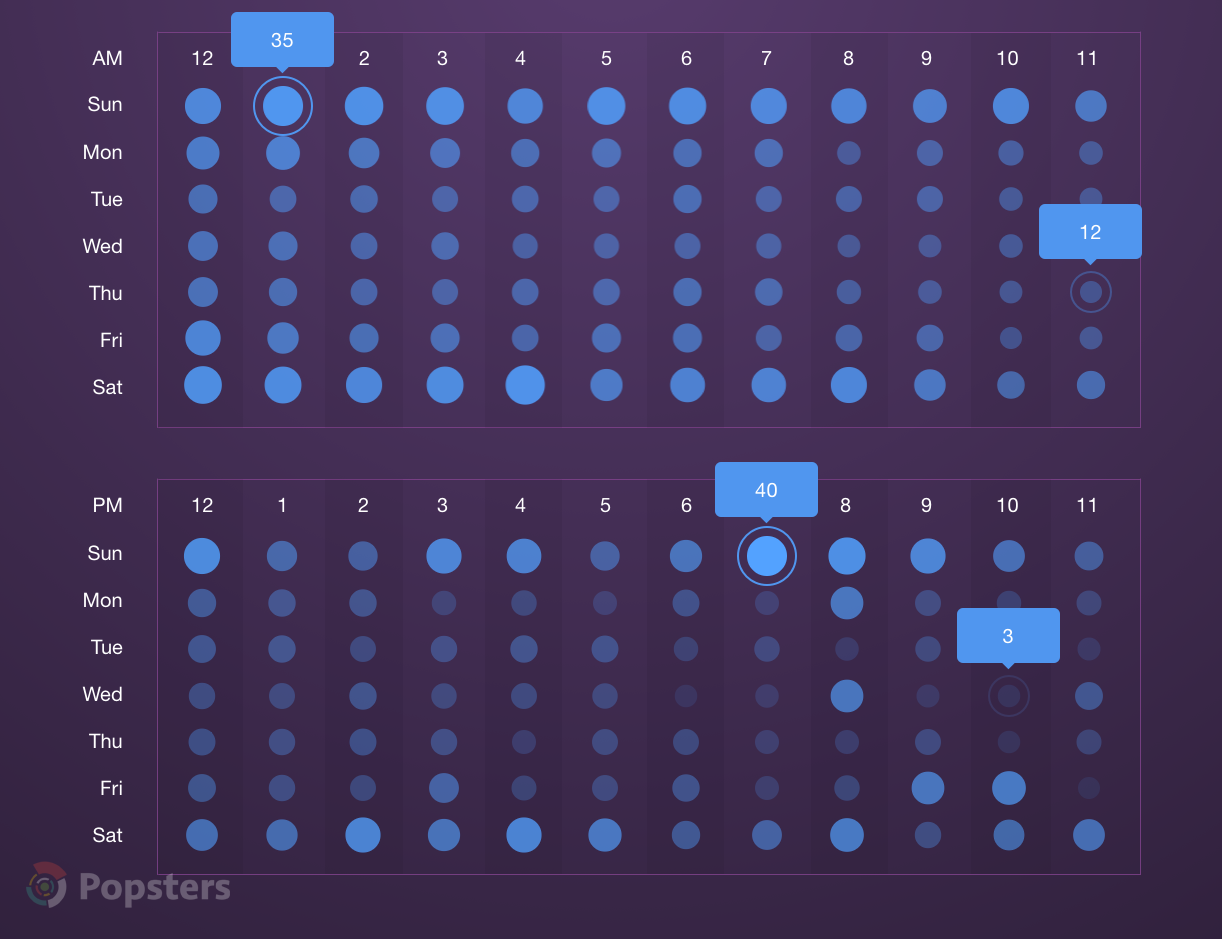
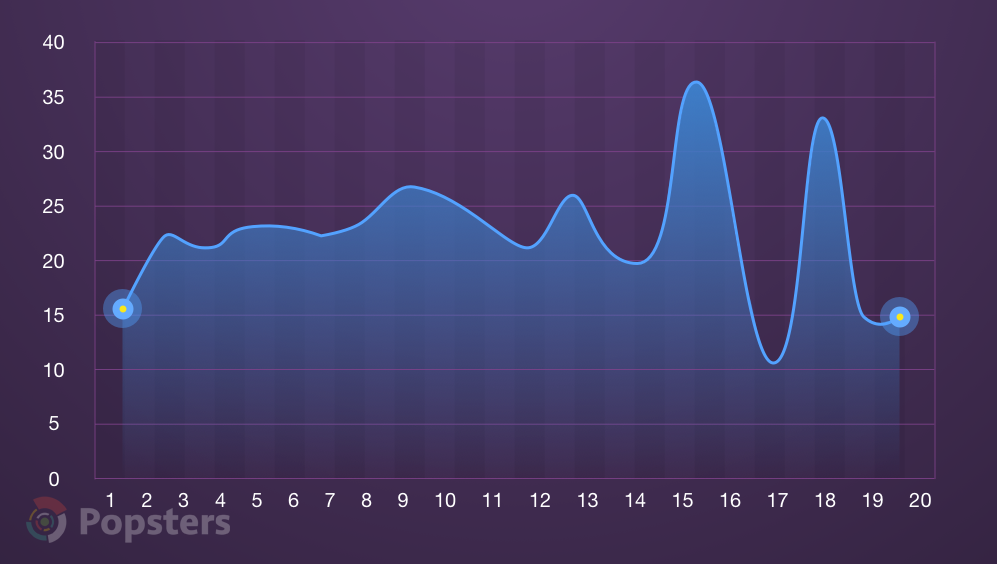
Summarized upvotes by hour
Summarized relative activity by hour, %
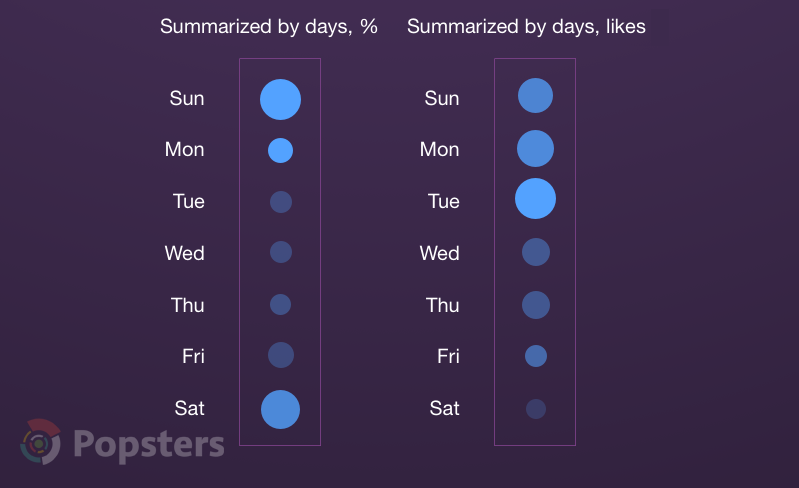
Summarized upvotes and relative % by day

Contrary to the popular belief that Tuesday is the best day to publish, Sunday turned out to be the day, between about midnight and 1 a.m., by both the chances to get higher in the Top and the upvotes count. For the same time on Monday and Tuesday, the average engagement was found to be a bit higher, however the chances to hit the Top are way lower. This nuance is important for new hunting products.
The worst time to be at the Top is Wednesday and Thursday. For any day, the activity for products published during the hours after 12:00 decreases significantly.
Activity as a Function of Content
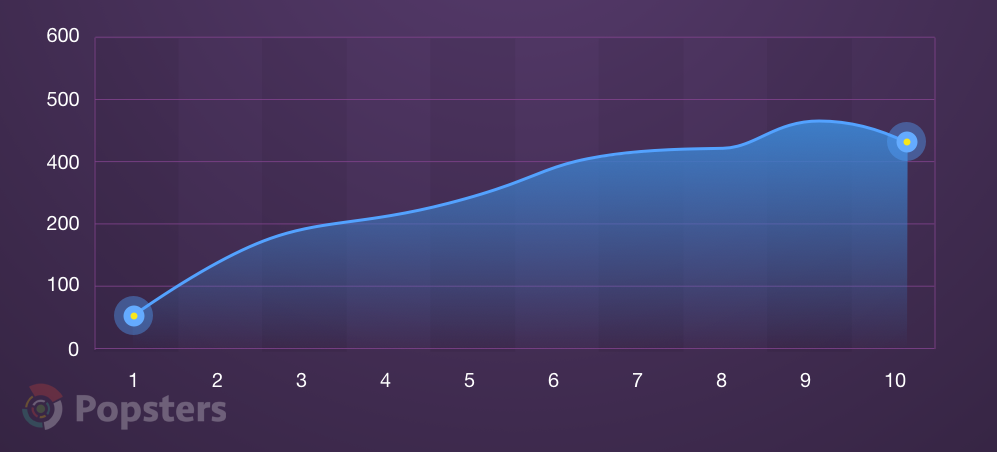
Average upvotes count vs. tags count
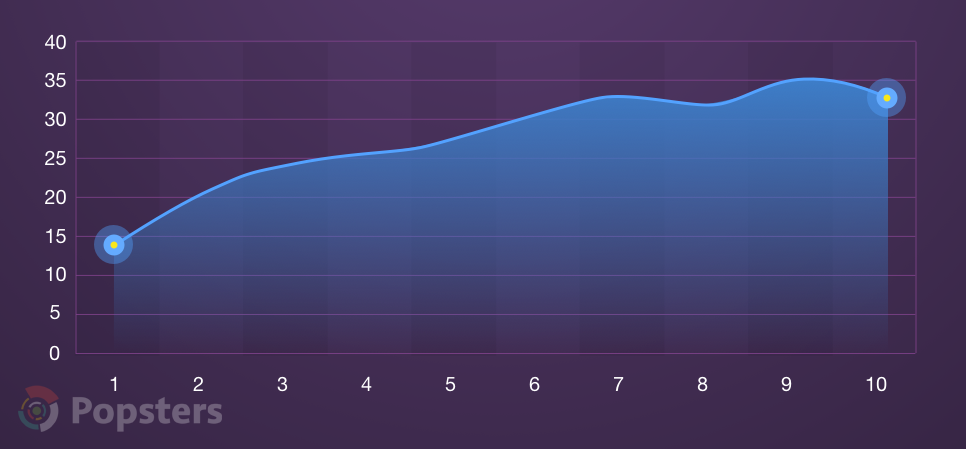
Average relative activity vs. tags count, %
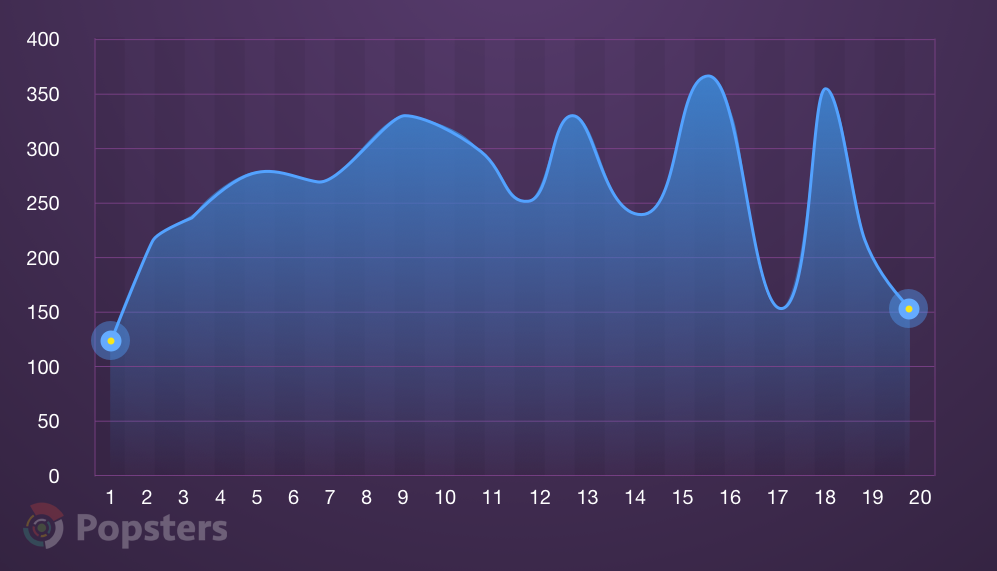
Average upvotes count vs. images count
Average relative activity vs. images count, %
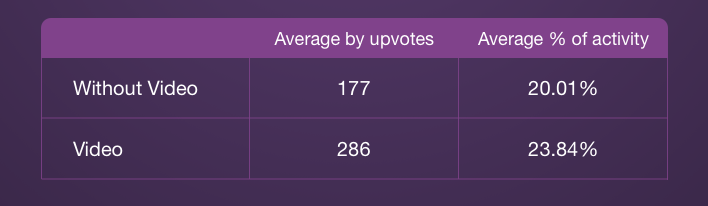
Activity vs. video availability
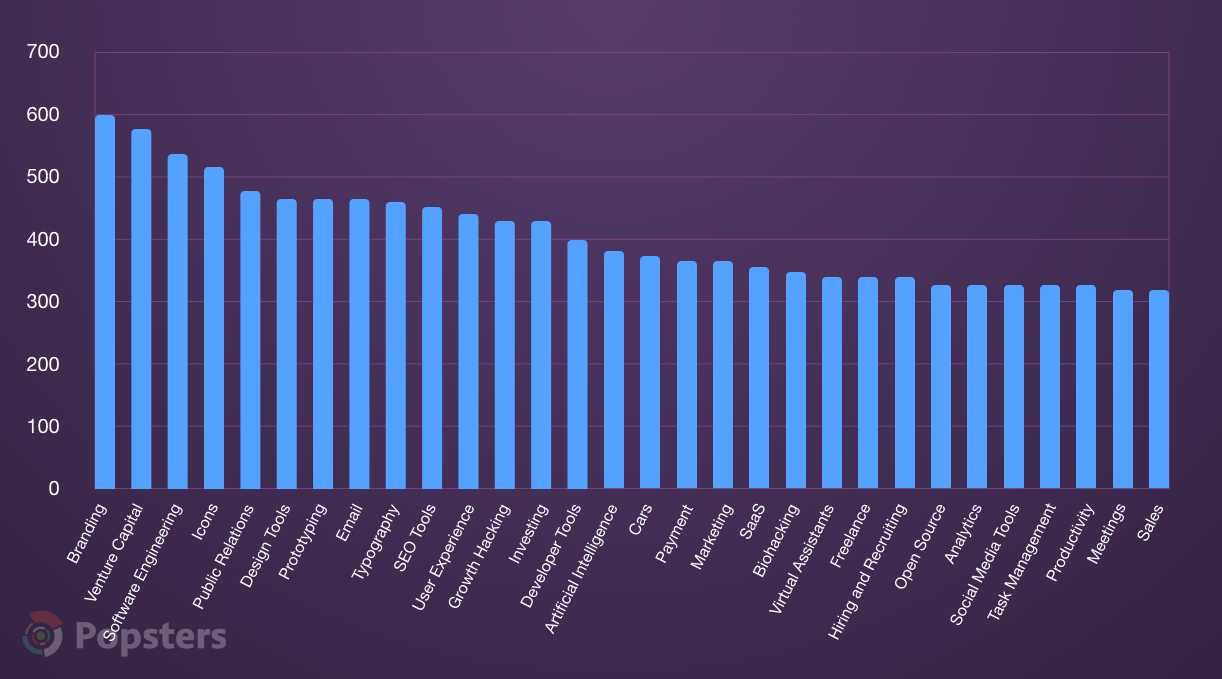
Top 30 tags by average upvotes count
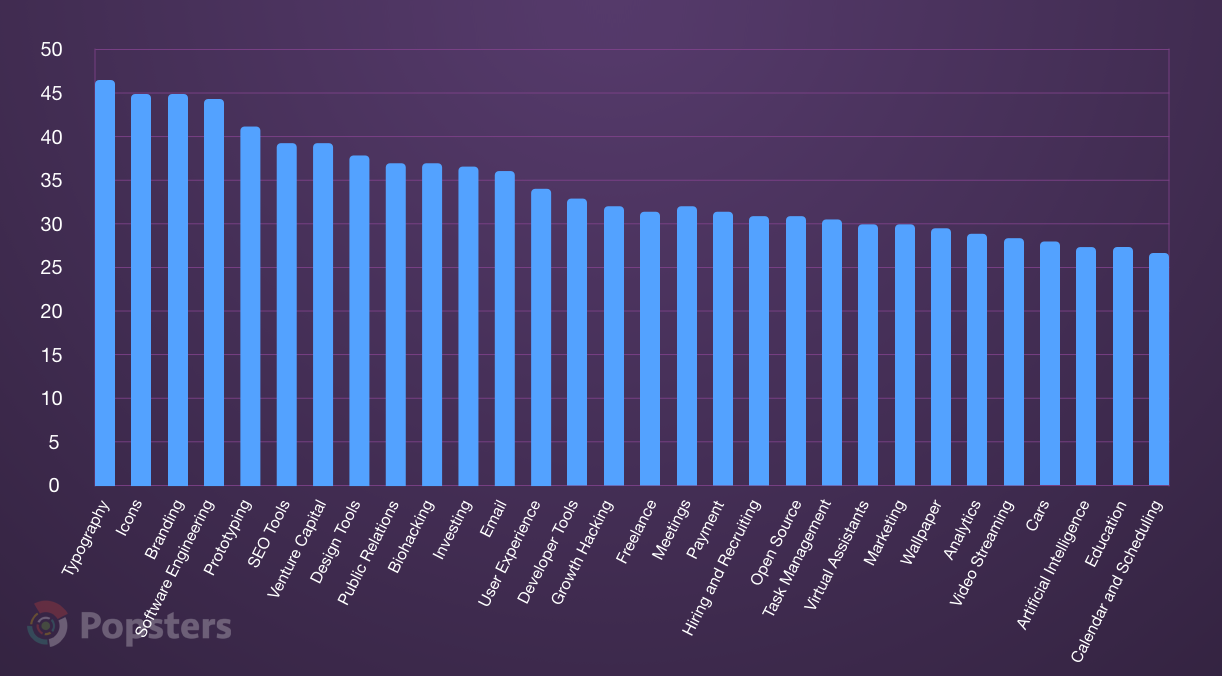
Top 30 tags by average activity, %
Projects marked with 7 to 9 tags were, on the average, closer to the Top and received more upvotes, as compared to projects with fewer tags. Apparently, this happened owing to getting into Product Hunt’s topic feeds.
The plots of activity vs. attached images count show statistics only for projects containing up to 20 images, although our analysis found hundreds of products with 30, 40 or even 60 various snapshots attached to the project description. However, the statistics demonstrate that 8 to 9 images are enough – more images often turn out to be less effective.
By the way, with Popsters you will have access to social media content analysis, so you will better understand the preferences of your users.
The video aspect appeared to be quite simple – statistically, projects that had video were higher in the Top and received more engagement than projects with no video. It is important for startup products to pay attention to this information.
As for project subjects, each parameter (proximity to Top 1 and upvotes count) was led by tools intended to aid design. Project management, investment management, and development tools were also close.
General Statistics for Product Hunt
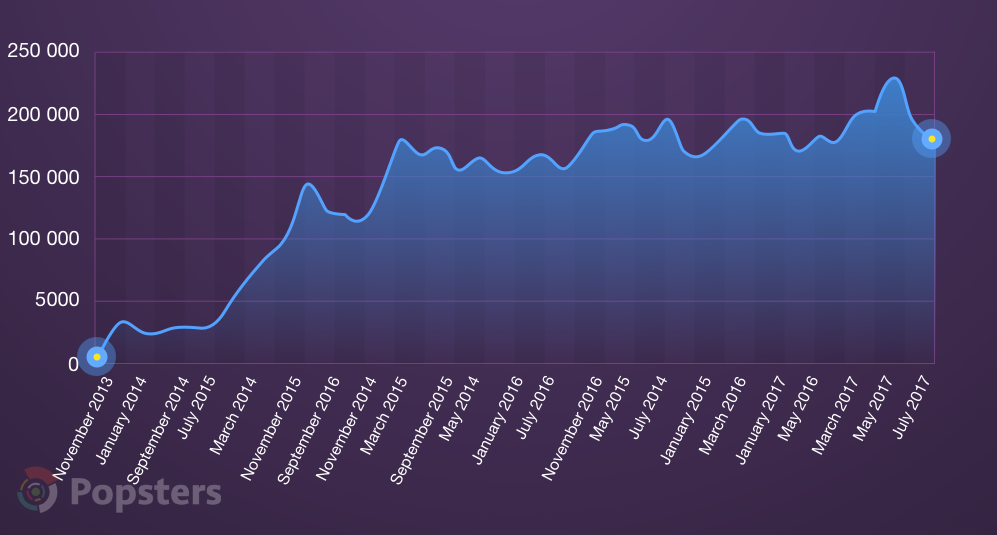
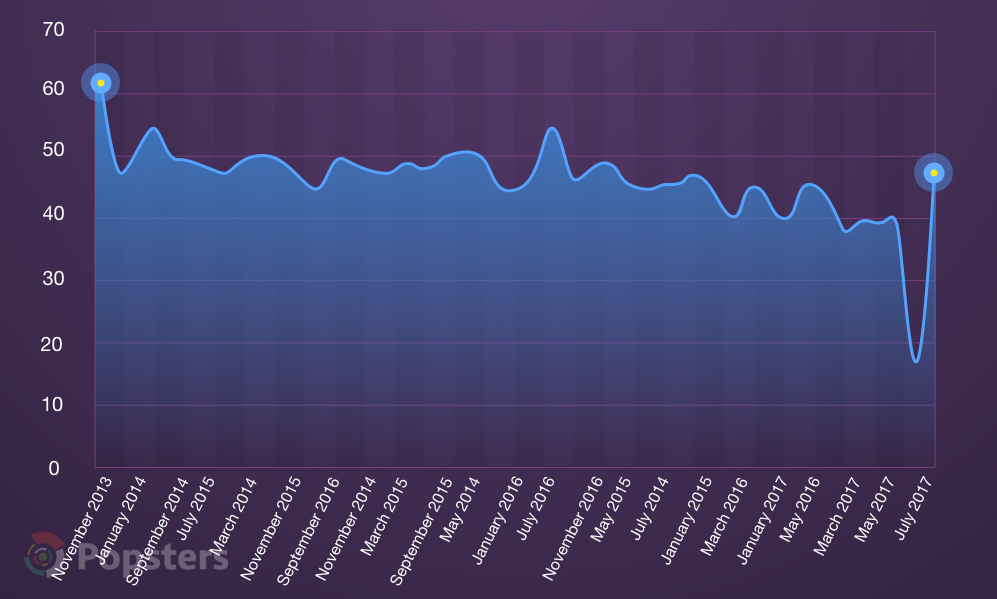
Total upvotes count by month
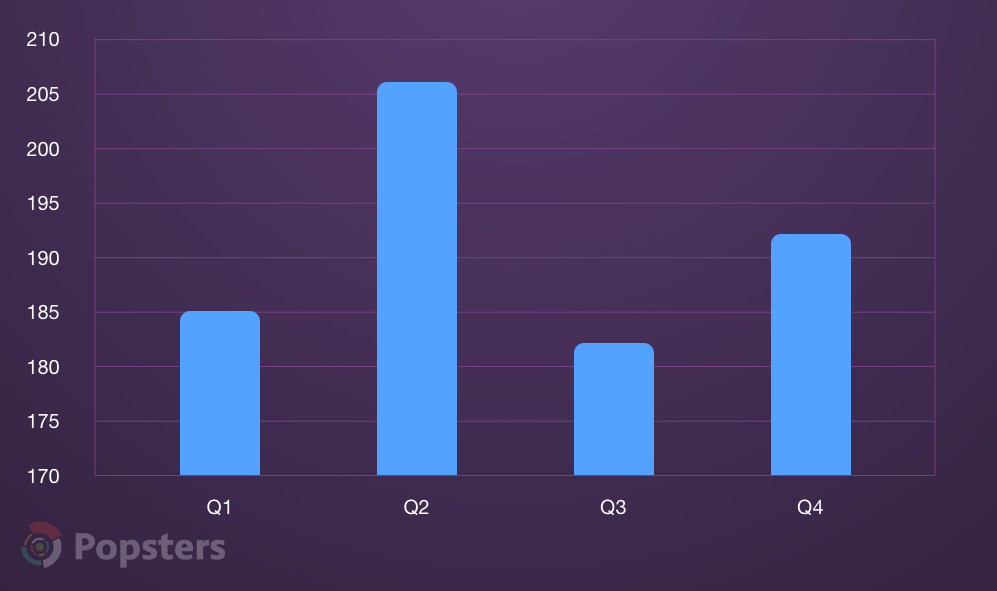
Project’s average upvotes count by quarter
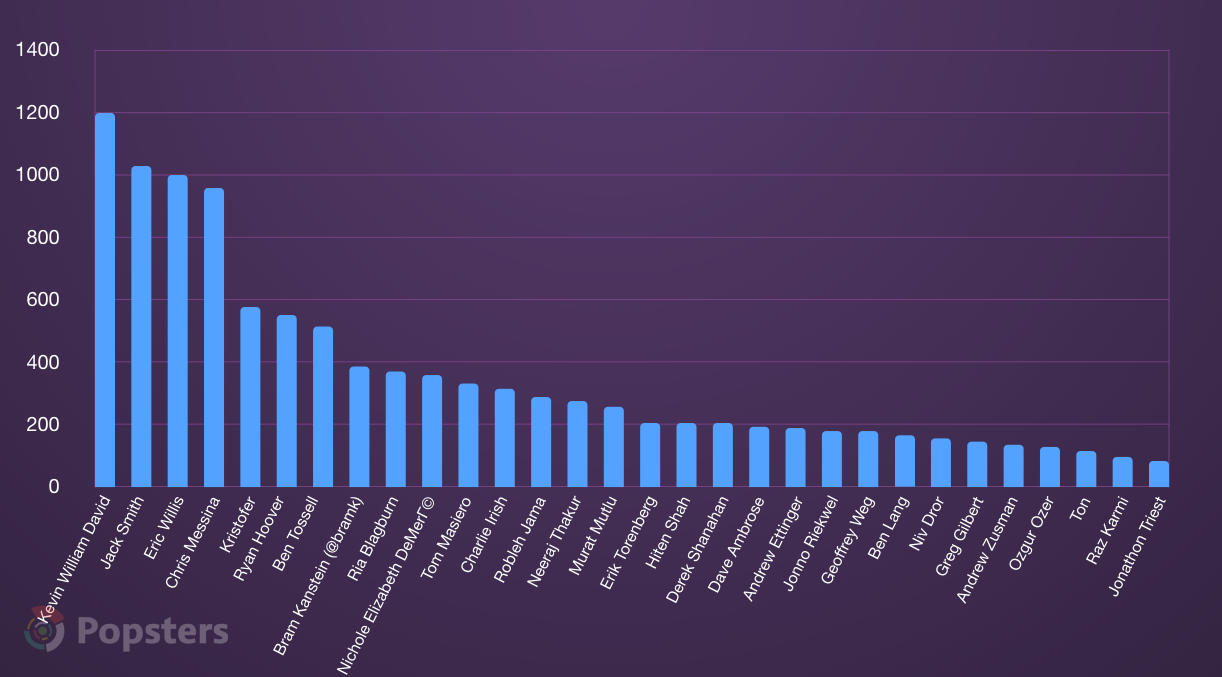
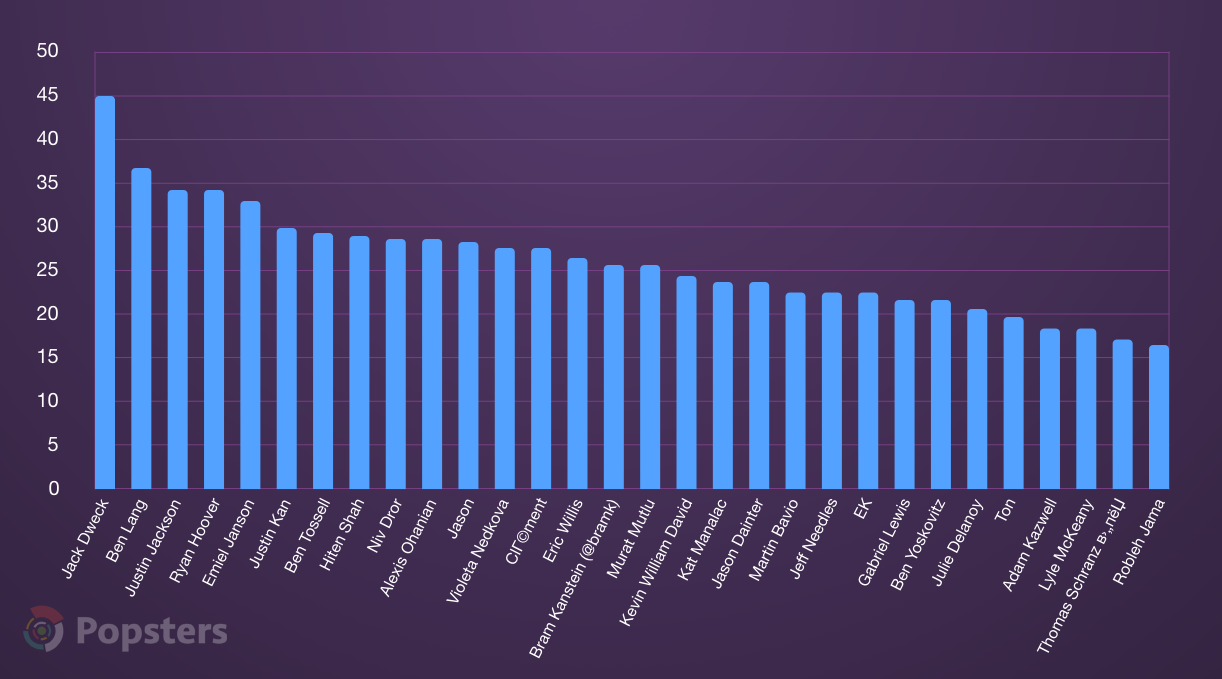
Top 30 most active hunters
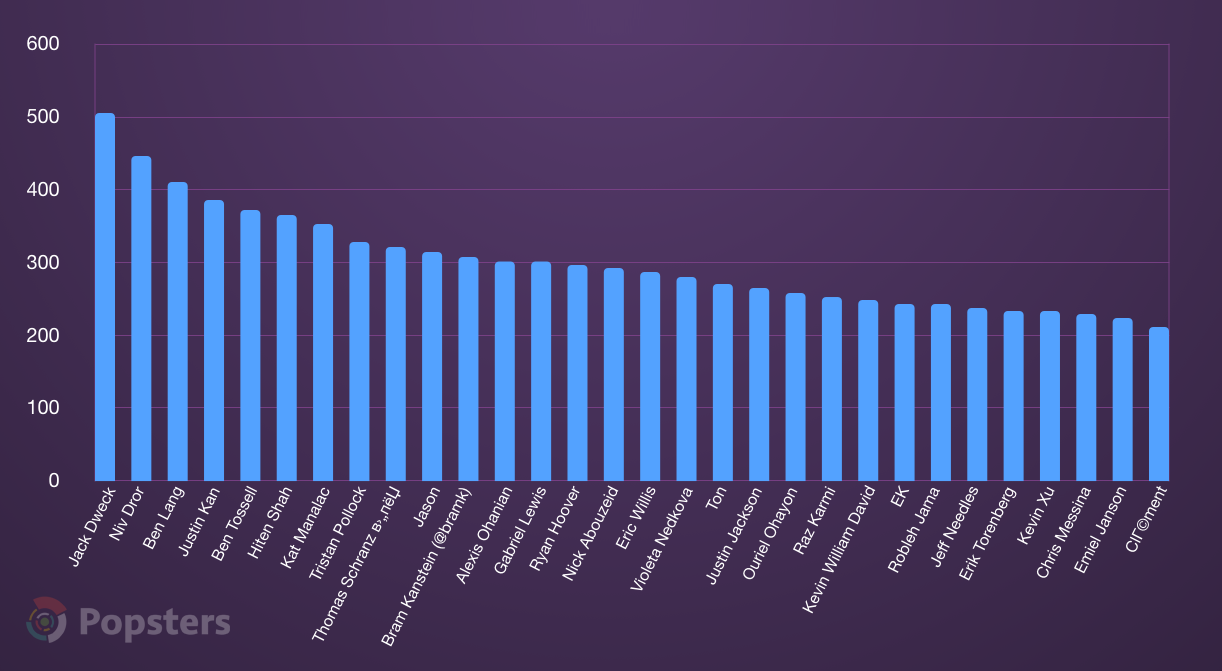
Top 30 hunters by average upvotes count
Top 30 hunters by average activity, %
Percentage of products currently closed, by date of publication at Product Hunt

Conclusion
The statistics show that different attributes of your project publication on Product Hunt may considerably influence your position and the overall placement effect.
Consider possible publication on weekends – since the number of publications is smaller on these days, you have higher chances to attract attention and hit the Top.
A stronger advantage would be adding a video or a sufficient number of images to demonstrate your product. If it is rather extensive, make sure to tag it in the description to get into feeds for various topics.
Enough attention to statistics, preparation and details will help you to get more from publication at Product Hunt.
Useful article on a similar topic:
- Top 35 Social Media Analytics Tools for Marketers.
Try Popsters Trial plan to get content activity statistics of any pages for a next 7 days for free
Try for free
Popular
-
 Analytics and Statistics for Any Telegram Channel or Chat
-
 How to Remove fake Followers on Instagram and Is It Necessary?
-
 YouTube Analytics and Statistics for Other Channels
-
 Instagram Statistics and Analysis: How to View Data of any Account
-
 How to Increase Telegram Subscribers: Best Free Ways
Try Popsters Trial plan to get content activity statistics of any pages for a next 7 days for free
Try Popsters