Social Networks Users Activity Report 2019
Popsters users analyze thousands of pages daily on 12 social networks. Depersonalized results (indicative values, activity trends, engagement) are stored on the server to collect a sufficient sample to study global audience activities.
The research is based on data of 604 million posts by 934 thousand public pages on 11 social networks (Google Plus was excluded from the results due to its shutdown). The data cover 150 countries, the metrics were reduced to a single time zone. A significant correlation was only found between different social networks and not detected between countries. The results were totalized.
The social networks covered are Facebook, Instagram, Twitter, YouTube, TikTok, VK.com, OK.ru, Telegram, Coub, Tumblr and Flickr.
The analysis is divided into 6 sections:
- Audience engagement by day;
- Engagement by hour;
- Activity vs text length;
- Activity by day and hour vs text length;
- Audience engagement for various post formats (by content type);
- Average Engagement Rate based on audience size, and average posting frequency.
For detailed methodology for each parameter, see the full version of the study.
Full text of the research (English)
Full text of the research (Russian)
Social Media Users Activity Global Research 2020
Social Networks Activity Research for 2018
Social Networks Activity Research for 2016
Audience activity by day
The most active day for Facebook is Sunday. Saturday shows at least the same activity as weekdays. Users take fewer actions on Tuesdays and Wednesdays.
As compared to the last year, Facebook has significantly higher activity on Sunday.

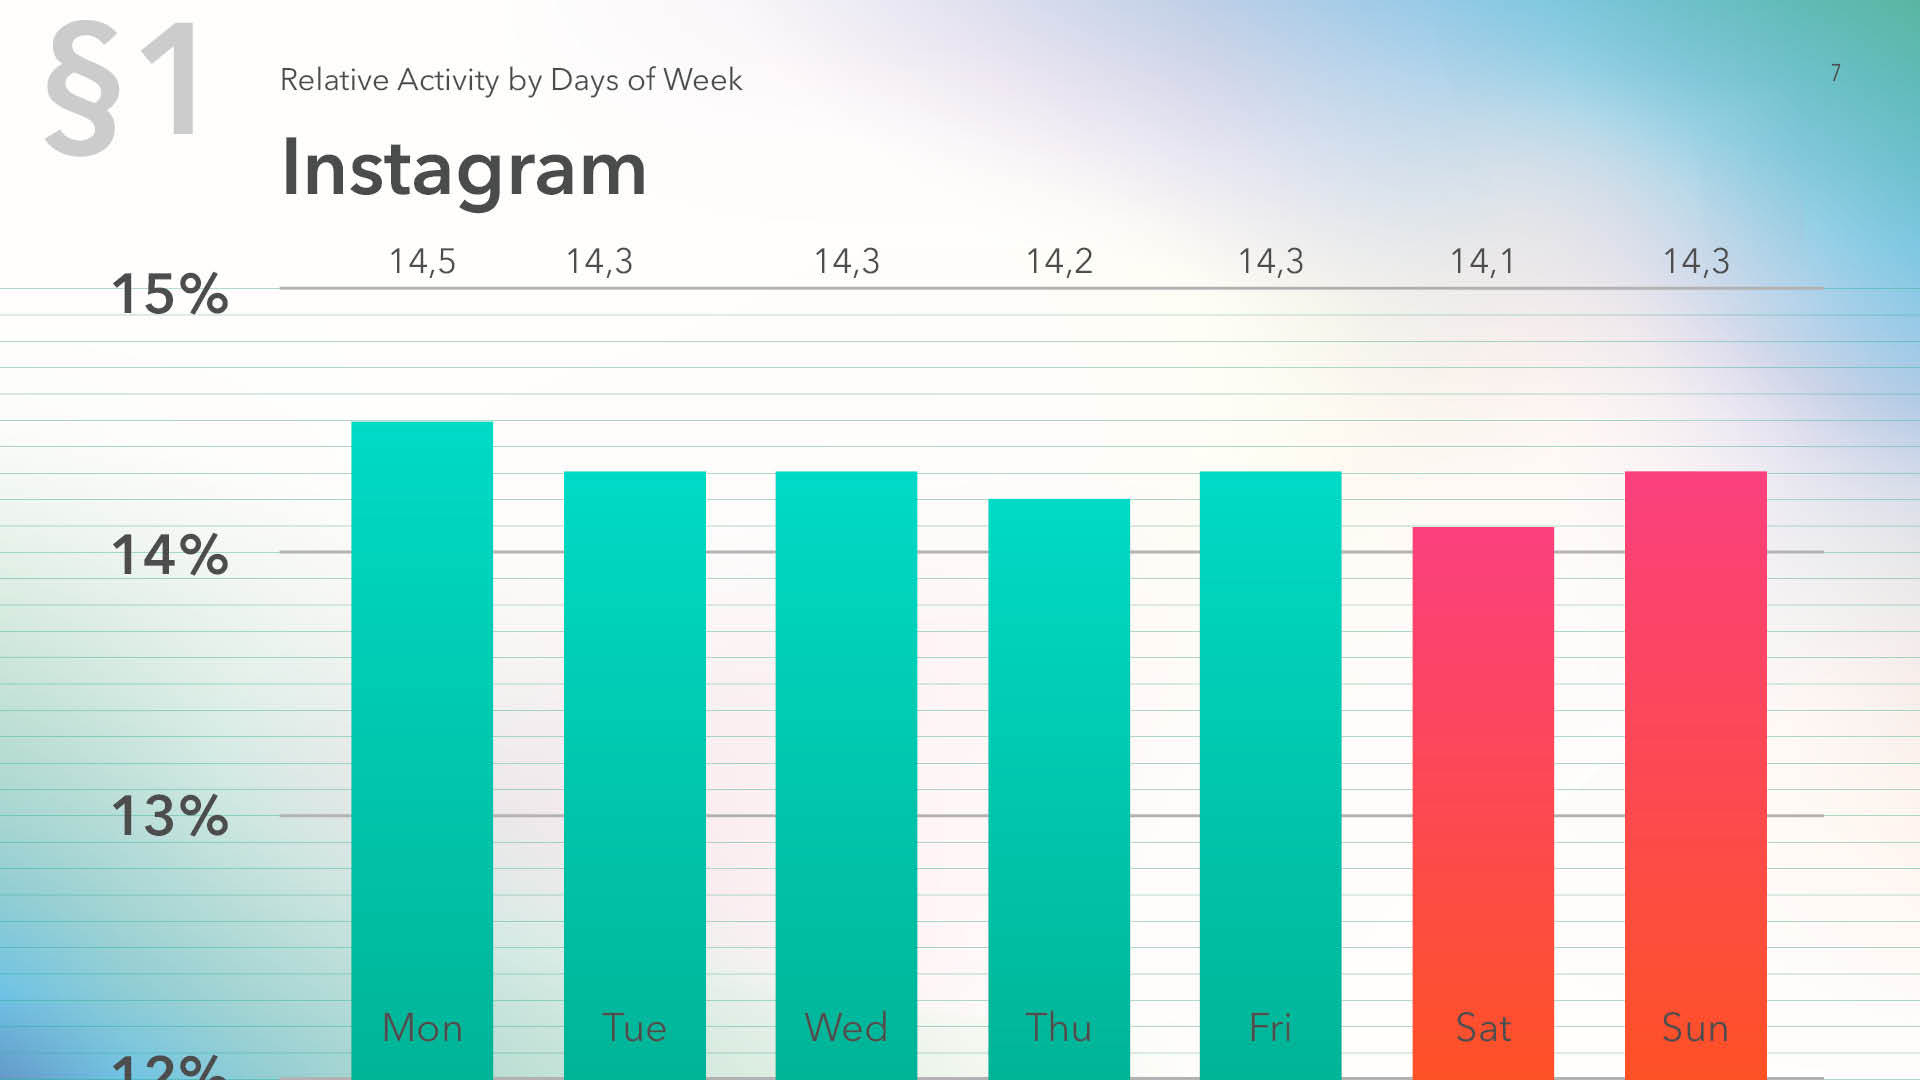
On Instagram Monday leads. The activity remains almost unchanged during weekdays. Users take least actions on Saturday.
Activities on Twitter have significantly increased over the year, with the weekend activities on posts being 17% for Sunday and 15.2% for Saturday. Users are least active on Thursday and Friday, receiving 13.1% of activities each.

YouTube has higher activity on Sundays and Fridays, with a reduction on Monday and Tuesday.
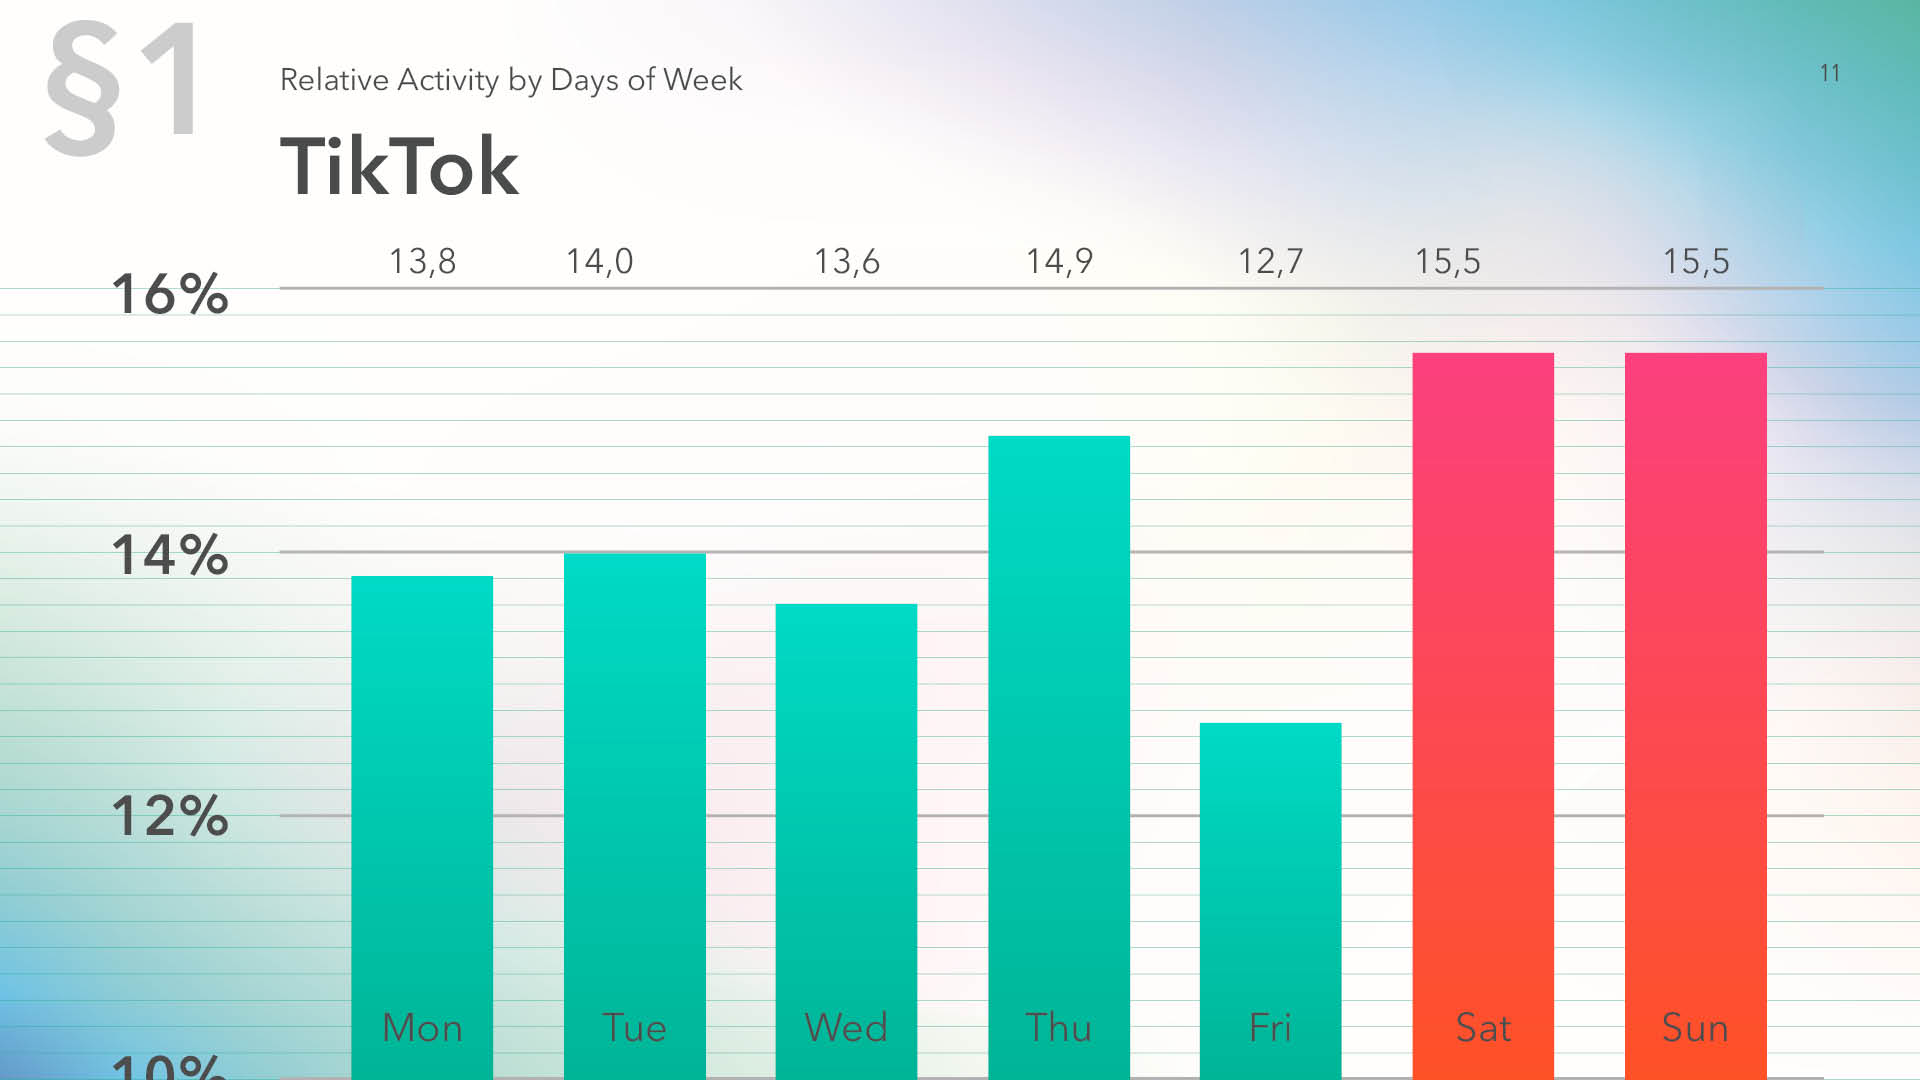
TikTok has 15.5% of all the activities on both Saturday and Sunday, with the weekday activities being almost unchanged and an insignificant drop seen on Friday.
The VK.com audience shows peak activity on Monday.
The least active day is Saturday. The rest of the days see approximately equal level of activity.
OK.ru has noticeably lower activity on weekends, with the lowest community activity values on Saturday. Monday received the peak activity. Friday posts came second, not far behind Monday.
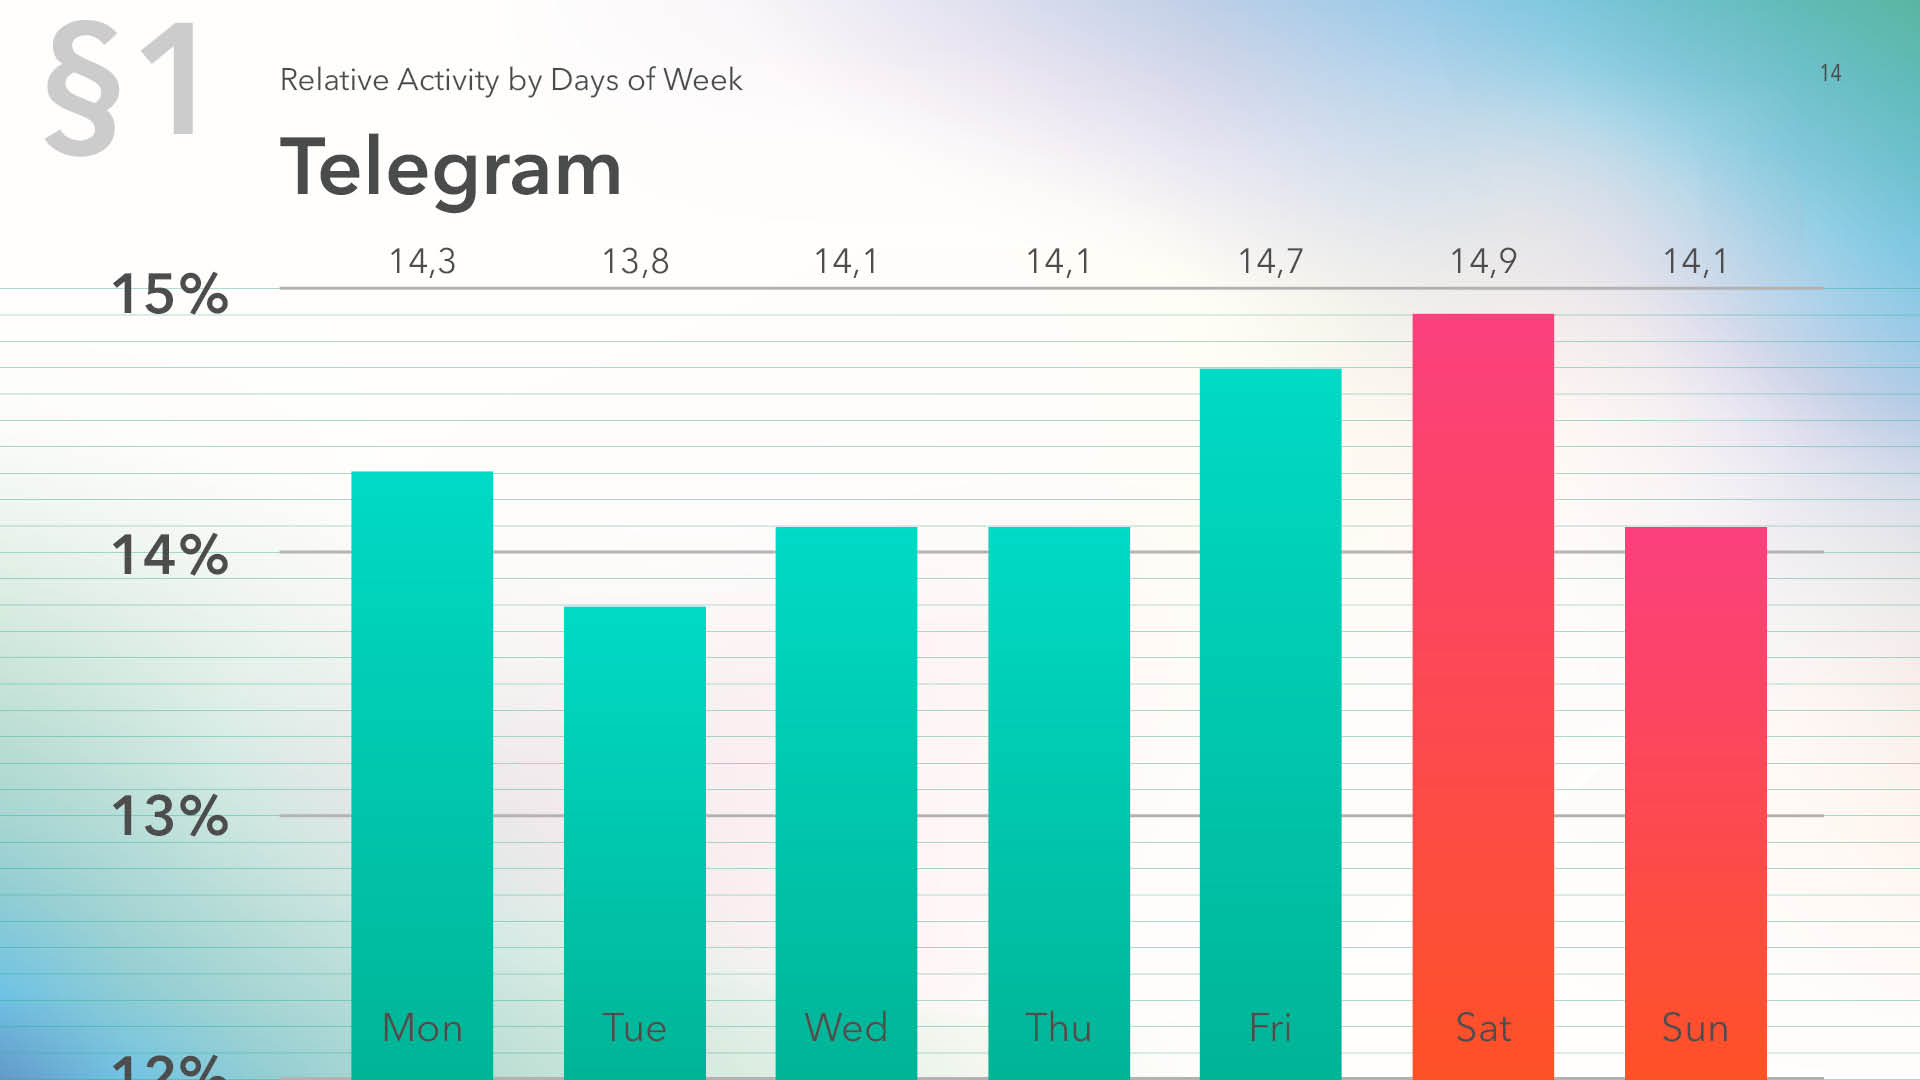
For Telegram, the activity leaders are Saturday and Friday. A decrease is seen on Tuesday.
On Tumblr, least activities are on Sunday, however Saturday ended up second by activity count, with only Thursday being ahead.
For Coub, the most active days are Saturday and Sunday, with a decrease on Tuesday and Thursday.
Flickr sees lower activities on Wednesday and Friday, with Thursday leading.
On the average for all the platforms, the activities are higher during weekends. Users take the least actions on Tuesdays and Fridays.
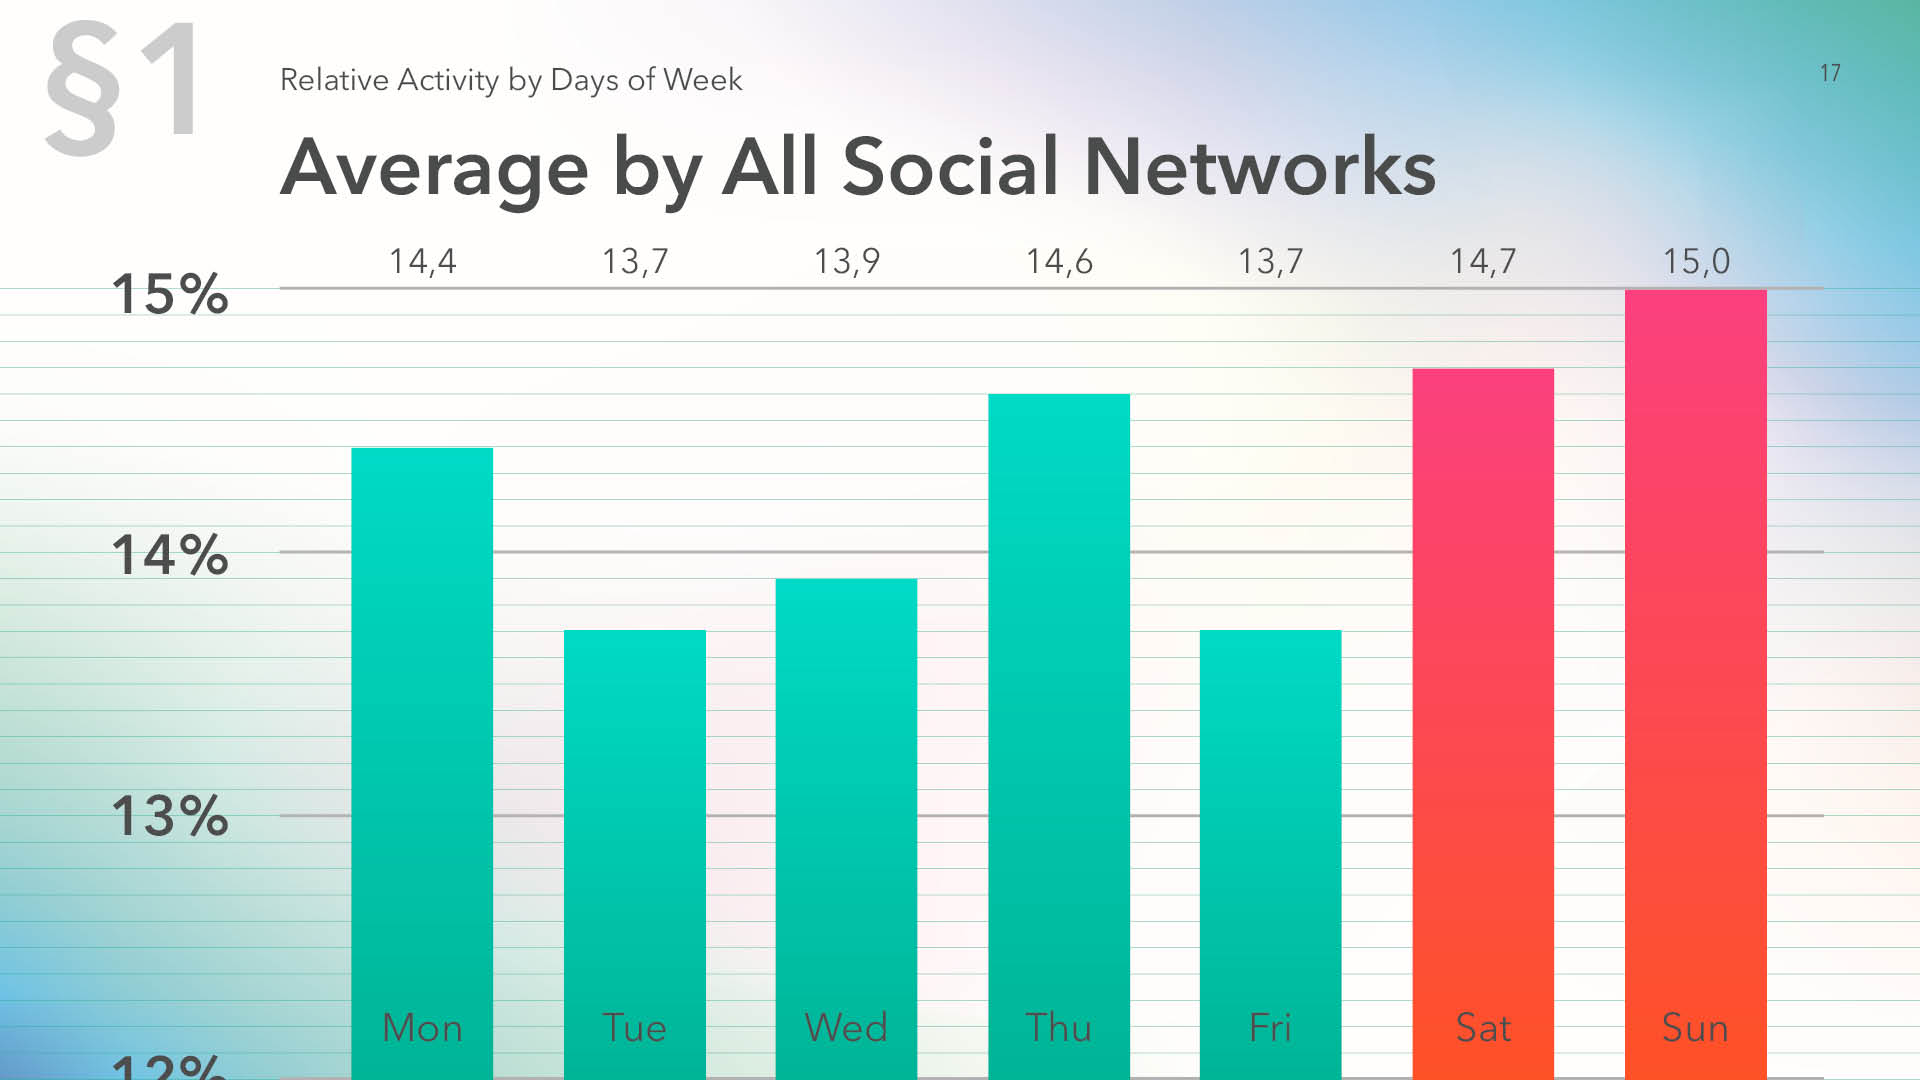
In 2018, activity was lower on Wednesday, while Saturday’s engagement was comparable to that for weekdays. Now the audience is more active on not only Sunday but Saturday as well, while weekdays see lower activity shifted from Wednesday to Friday and Tuesday.
Social Network Audience Activities vs Posting Time
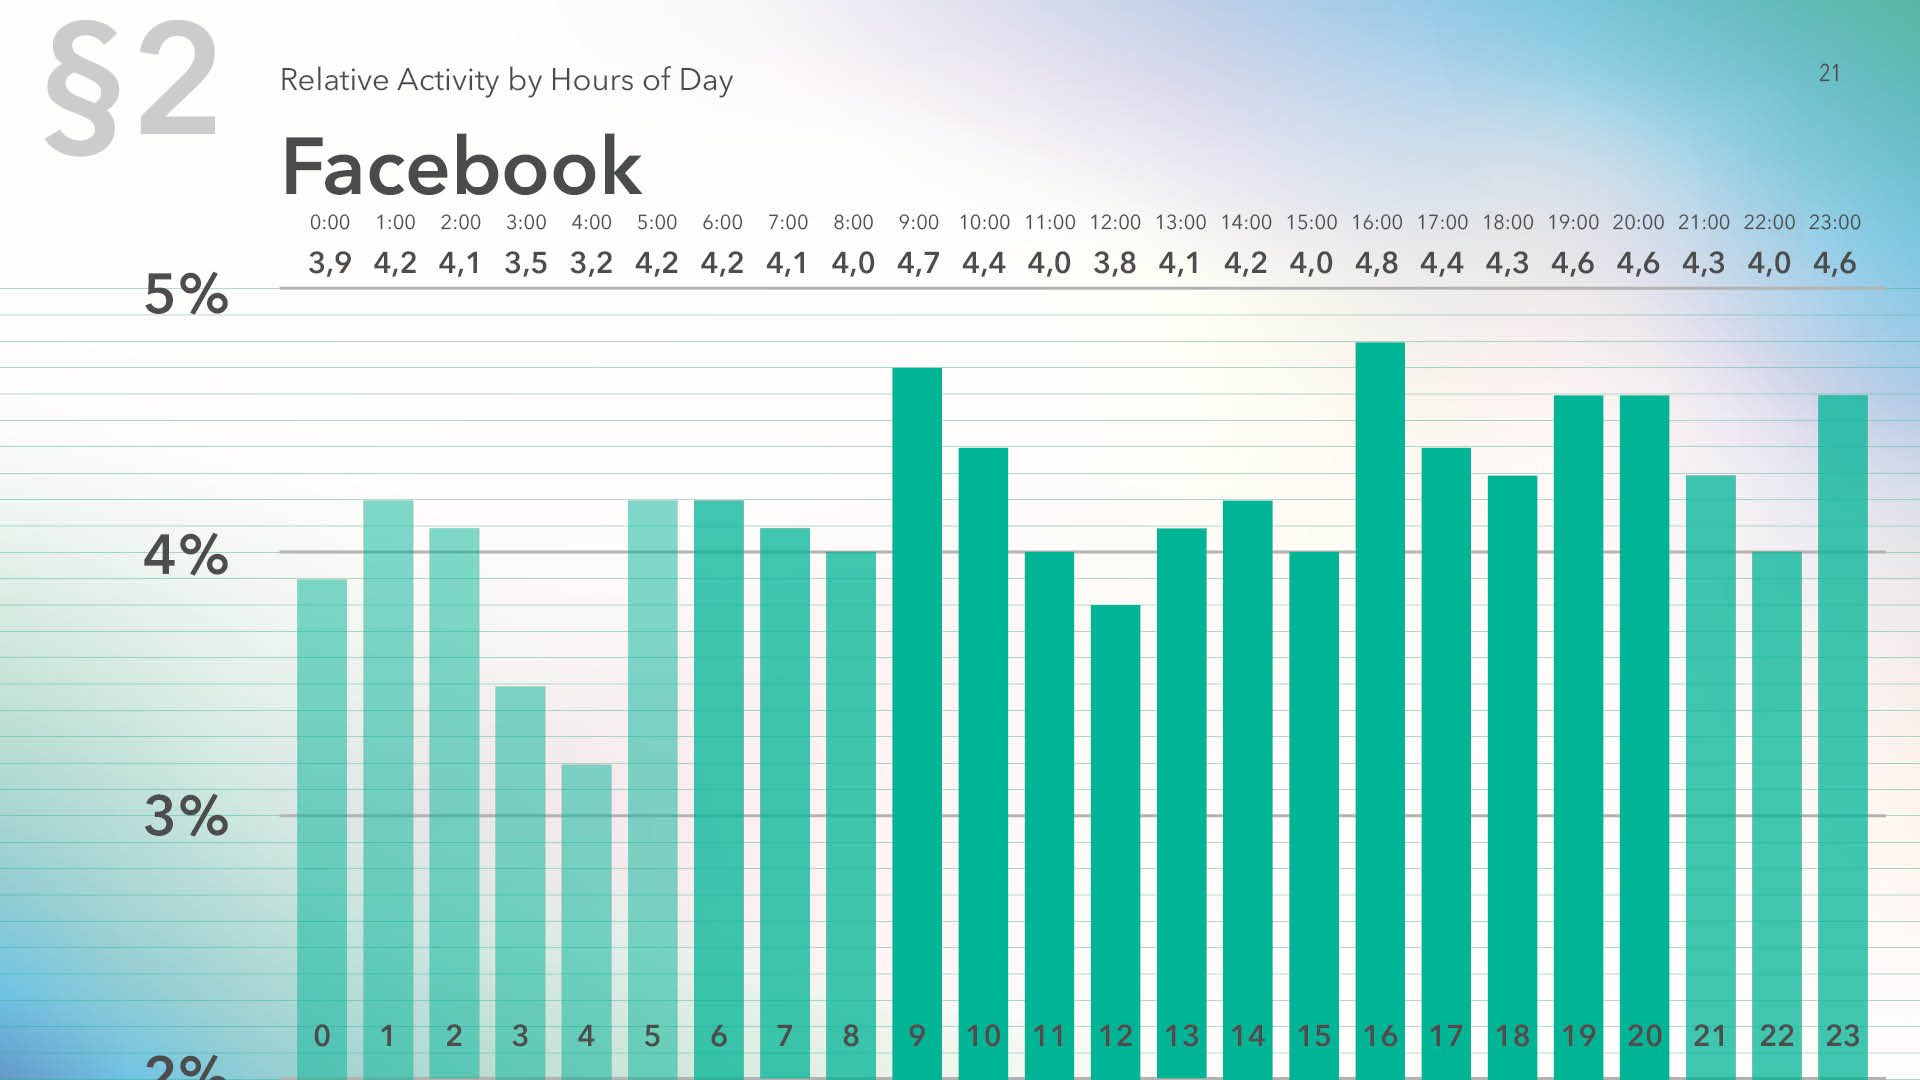
Facebook shows a strong relation between time and activity, with the highest activities at 9 a.m., 4 p.m. and 11 p.m.
The least engagement is received by posts published at 4 and 3 a.m.
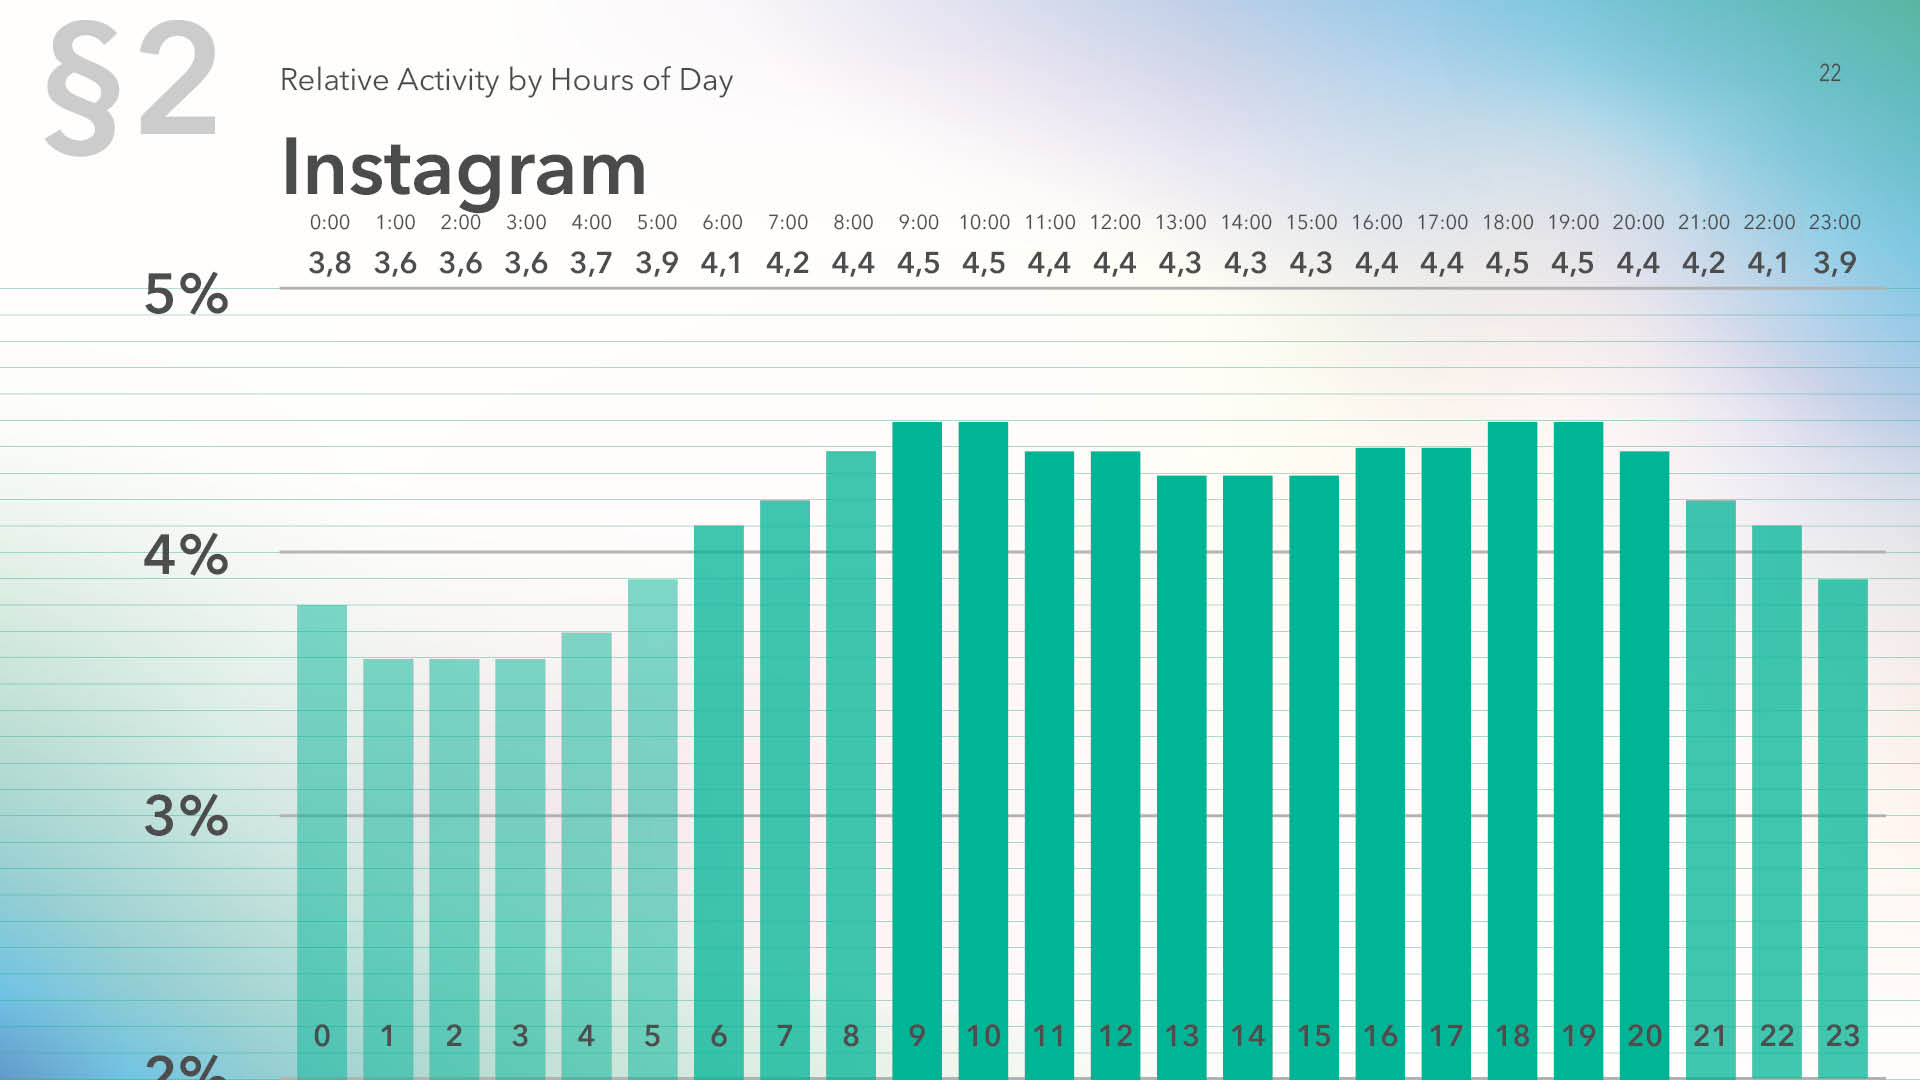
The Instagram audience is active between 8 a.m. and 8 p.m. The best time to post on Instagram, as per the study data, is 9 and 10 a.m., and 6 and 7 p.m.
On YouTube, videos posted at 10 a.m. and 4 p.m. receive much more engagement; users are also active at 5 and 7 p.m. The period that is inopportune in terms of activity is between 9 p.m. and 4 a.m.
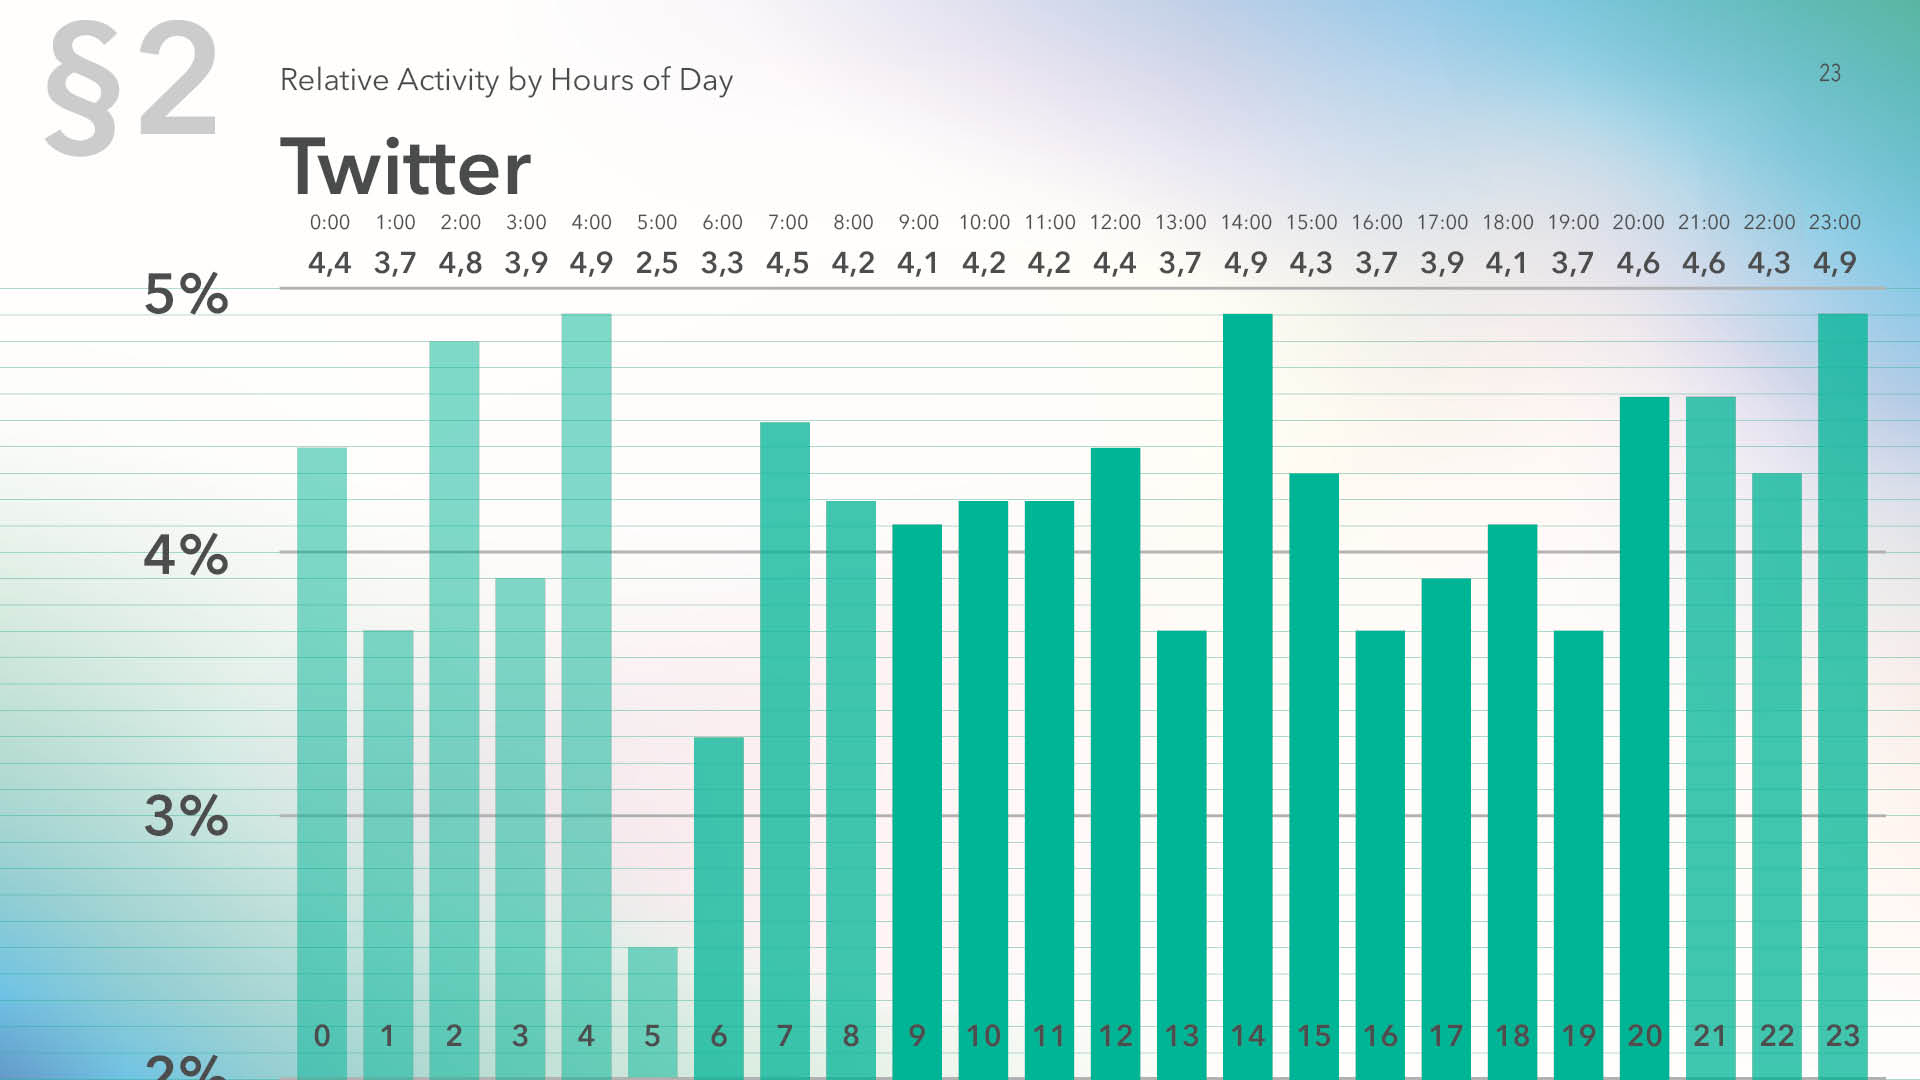
The activity histogram for Twitter became less even — there are now sharp activity peaks with an interval of 1 to 2 hours and a steep drop at 5 a.m. This is probably due to the introduction of the new algorithmic feed early in the year.
VK shows activities almost unchanged during the day, except for that between 1:00 and 6:00 a.m. The peak is at 9 p.m.
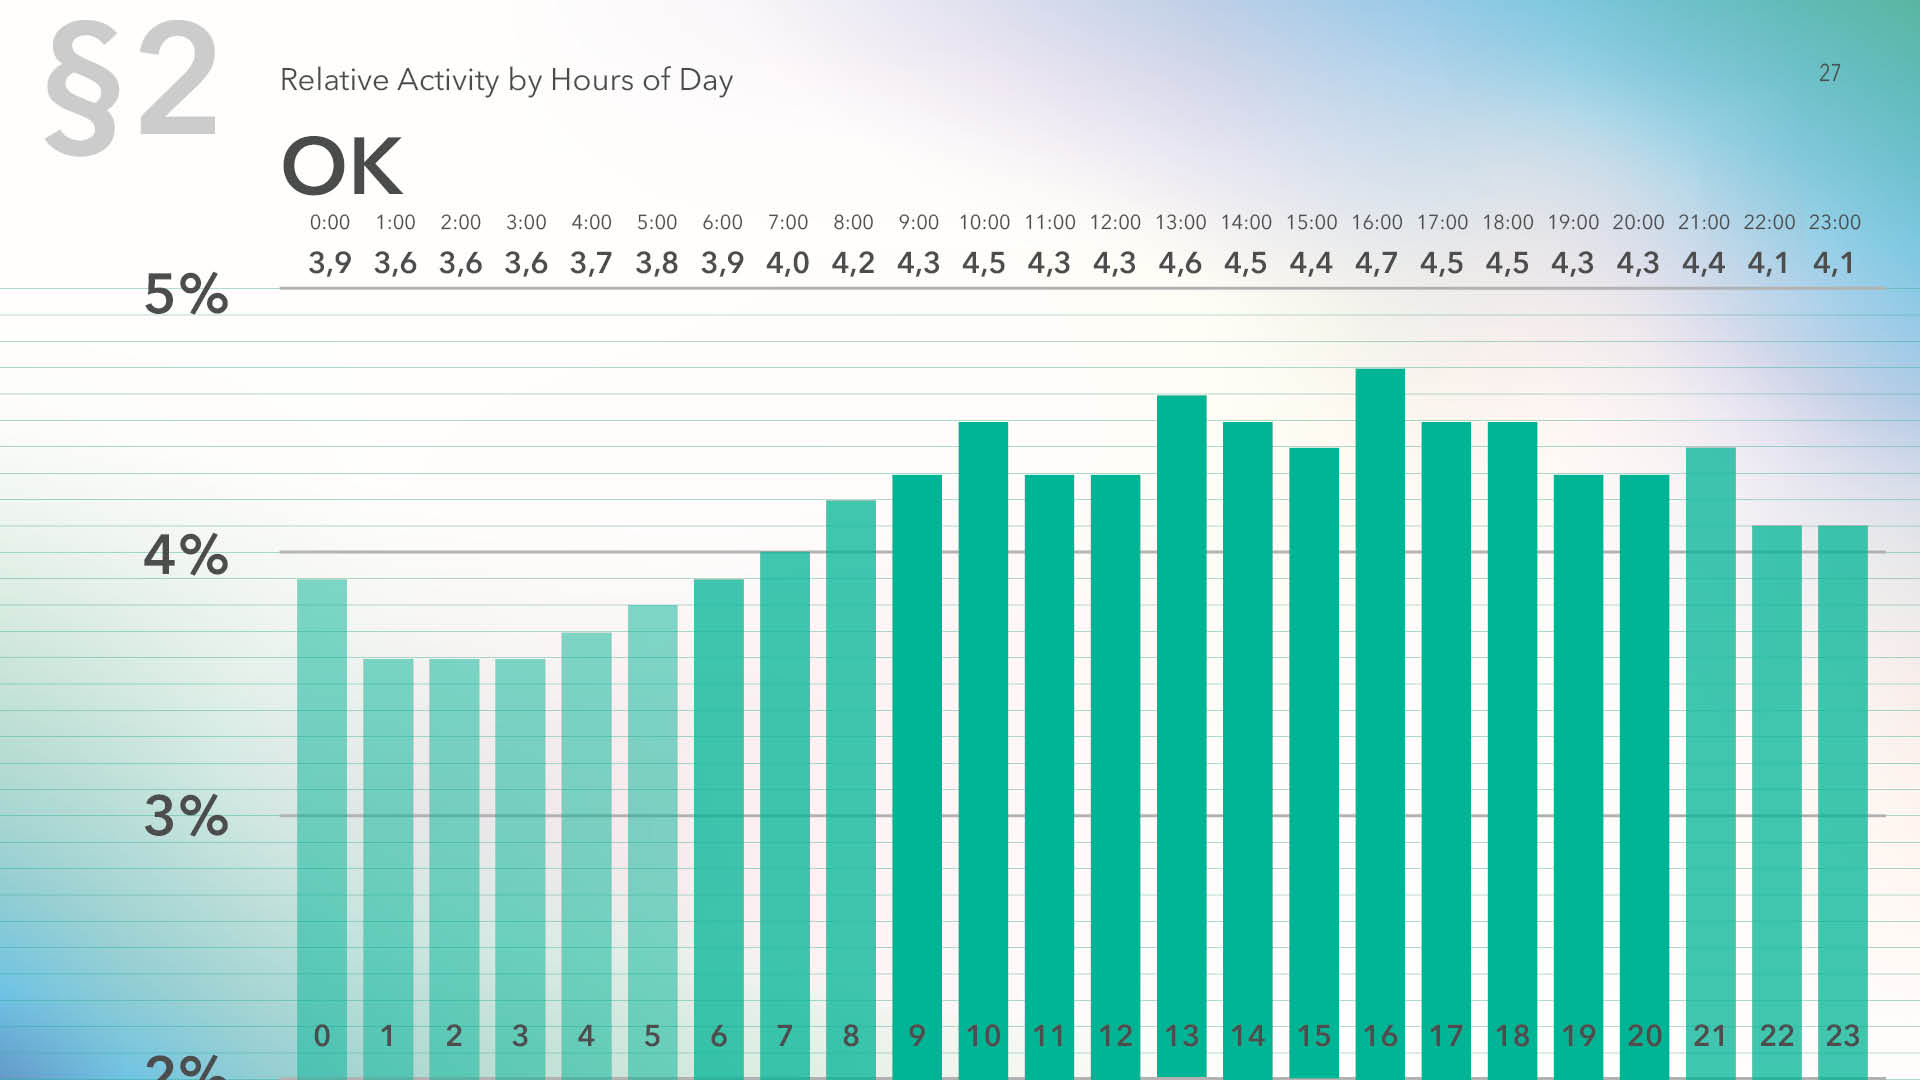
OK users are less active between 10 p.m. and 7 a.m. Peak activity takes place at 4 p.m., as well as 5 p.m. and 10 a.m.
As opposed to other platforms, Telegram sees night hours more active than day hours. The activity peaks are at 4 a.m., 12 and 3 p.m.
On Tumblr, activity growth is sharp at 11 a.m, which is the time receiving 8.2% of the total daily activity.
On Flickr, more engagement is received by posts placed at 2 or 5 p.m.
On the average for all the platforms, the best time to post is 11 a.m., 2 and 5 p.m. The most silent hours are 2, 3 and 5 a.m.
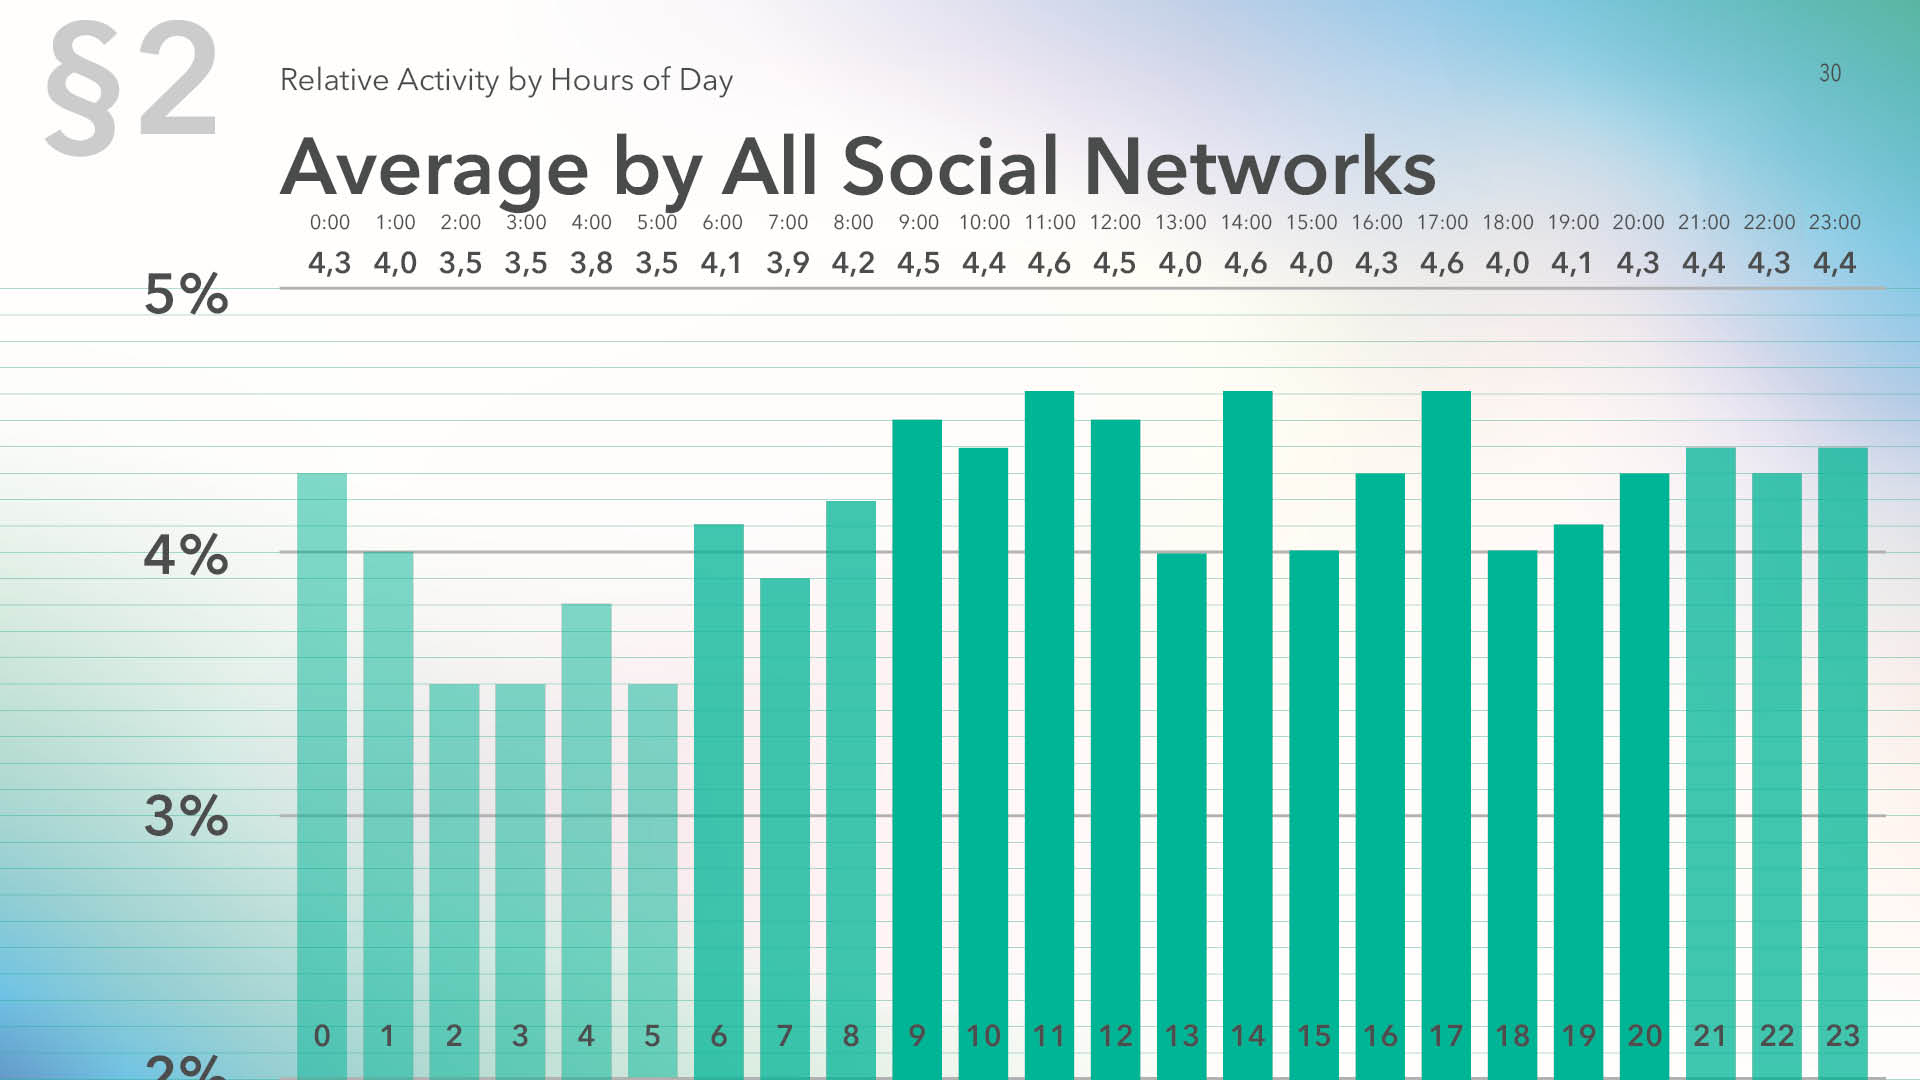
As compared to the last year, activities by hour became more prominent: a noticeable drop during night hours (2 to 5 a.m.) and a growth in activity in the noontime (12 a.m. to 2 p.m.).
Audience Activity vs Text Length
Popsters categorizes posts into three types and measures the audience engagement for different posts based on the text length they contain:
Short text: up to 160 characters
Medium-size text: 160 to 1000 characters
Long text: more than 1000 characters
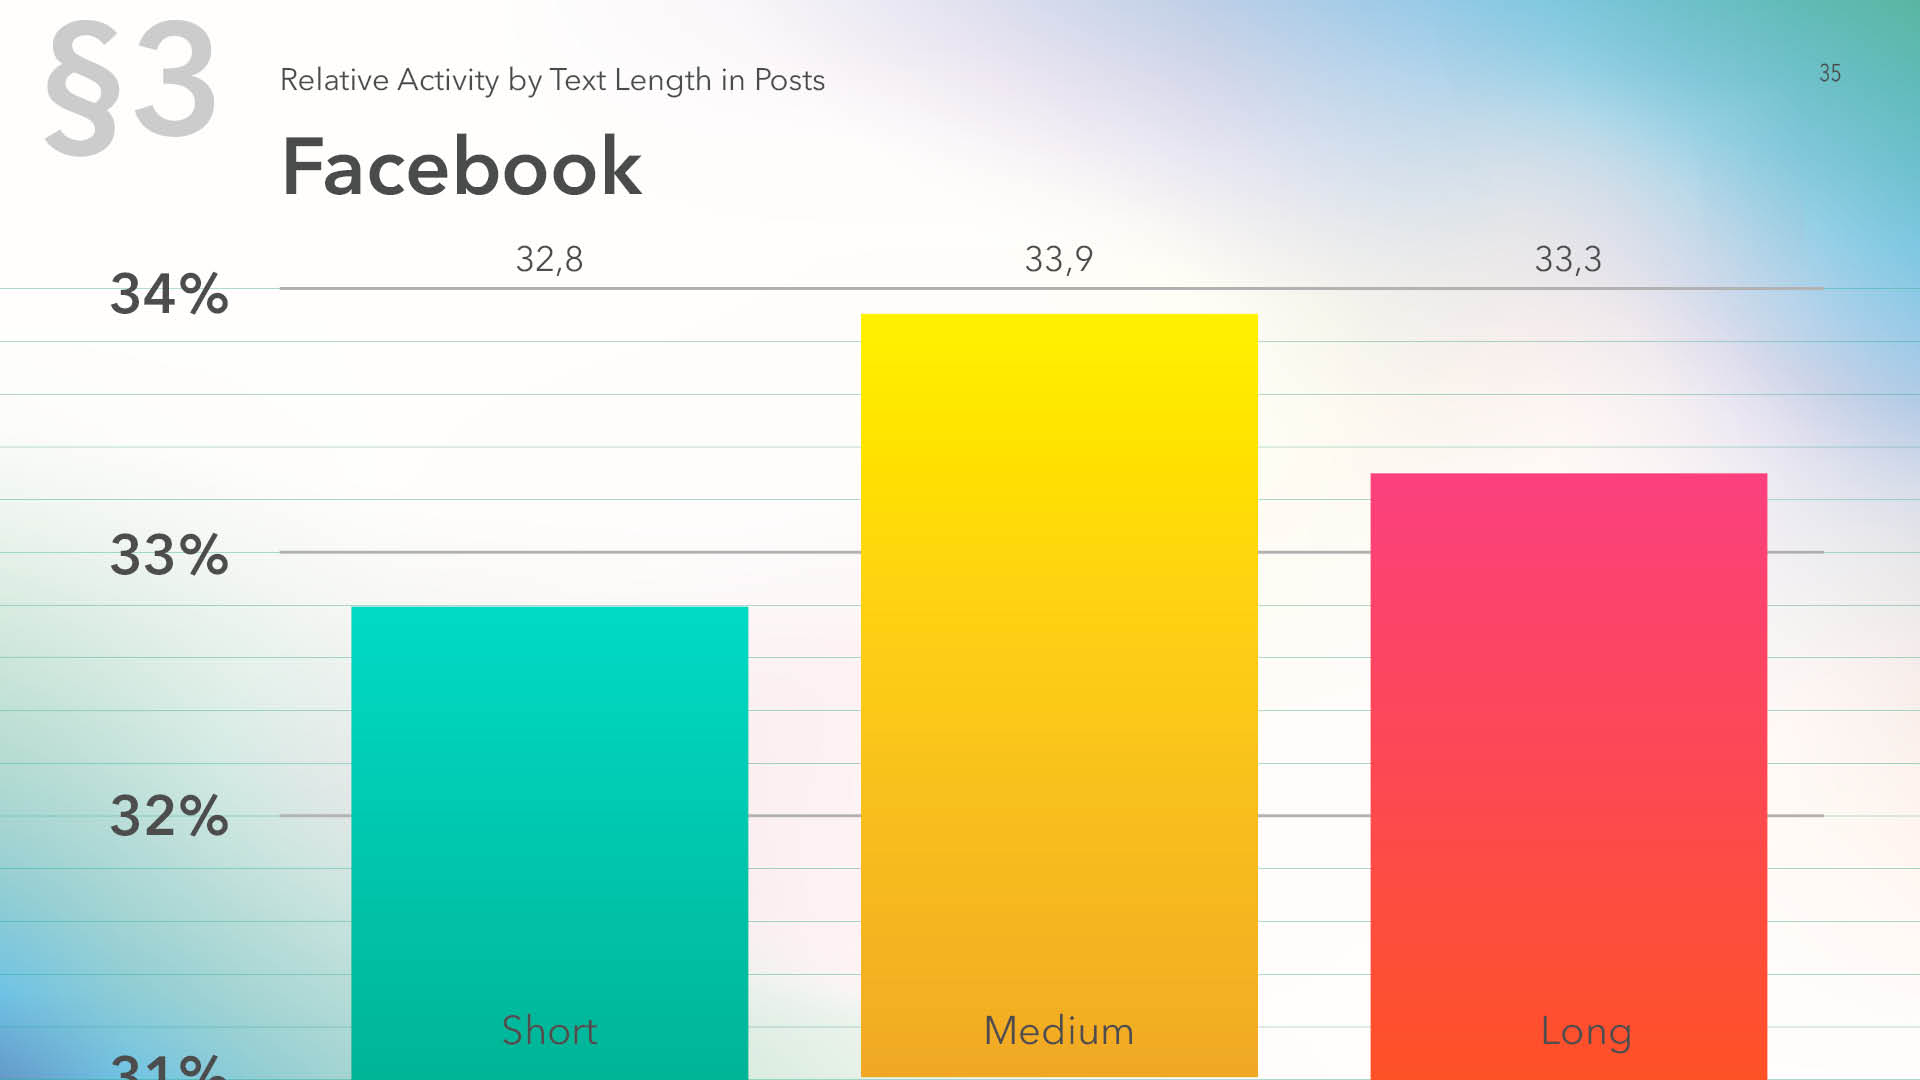
On Facebook, medium-size posts are leading. Long texts are second in the activities received, with short texts turning out to be least engaging on this platform.
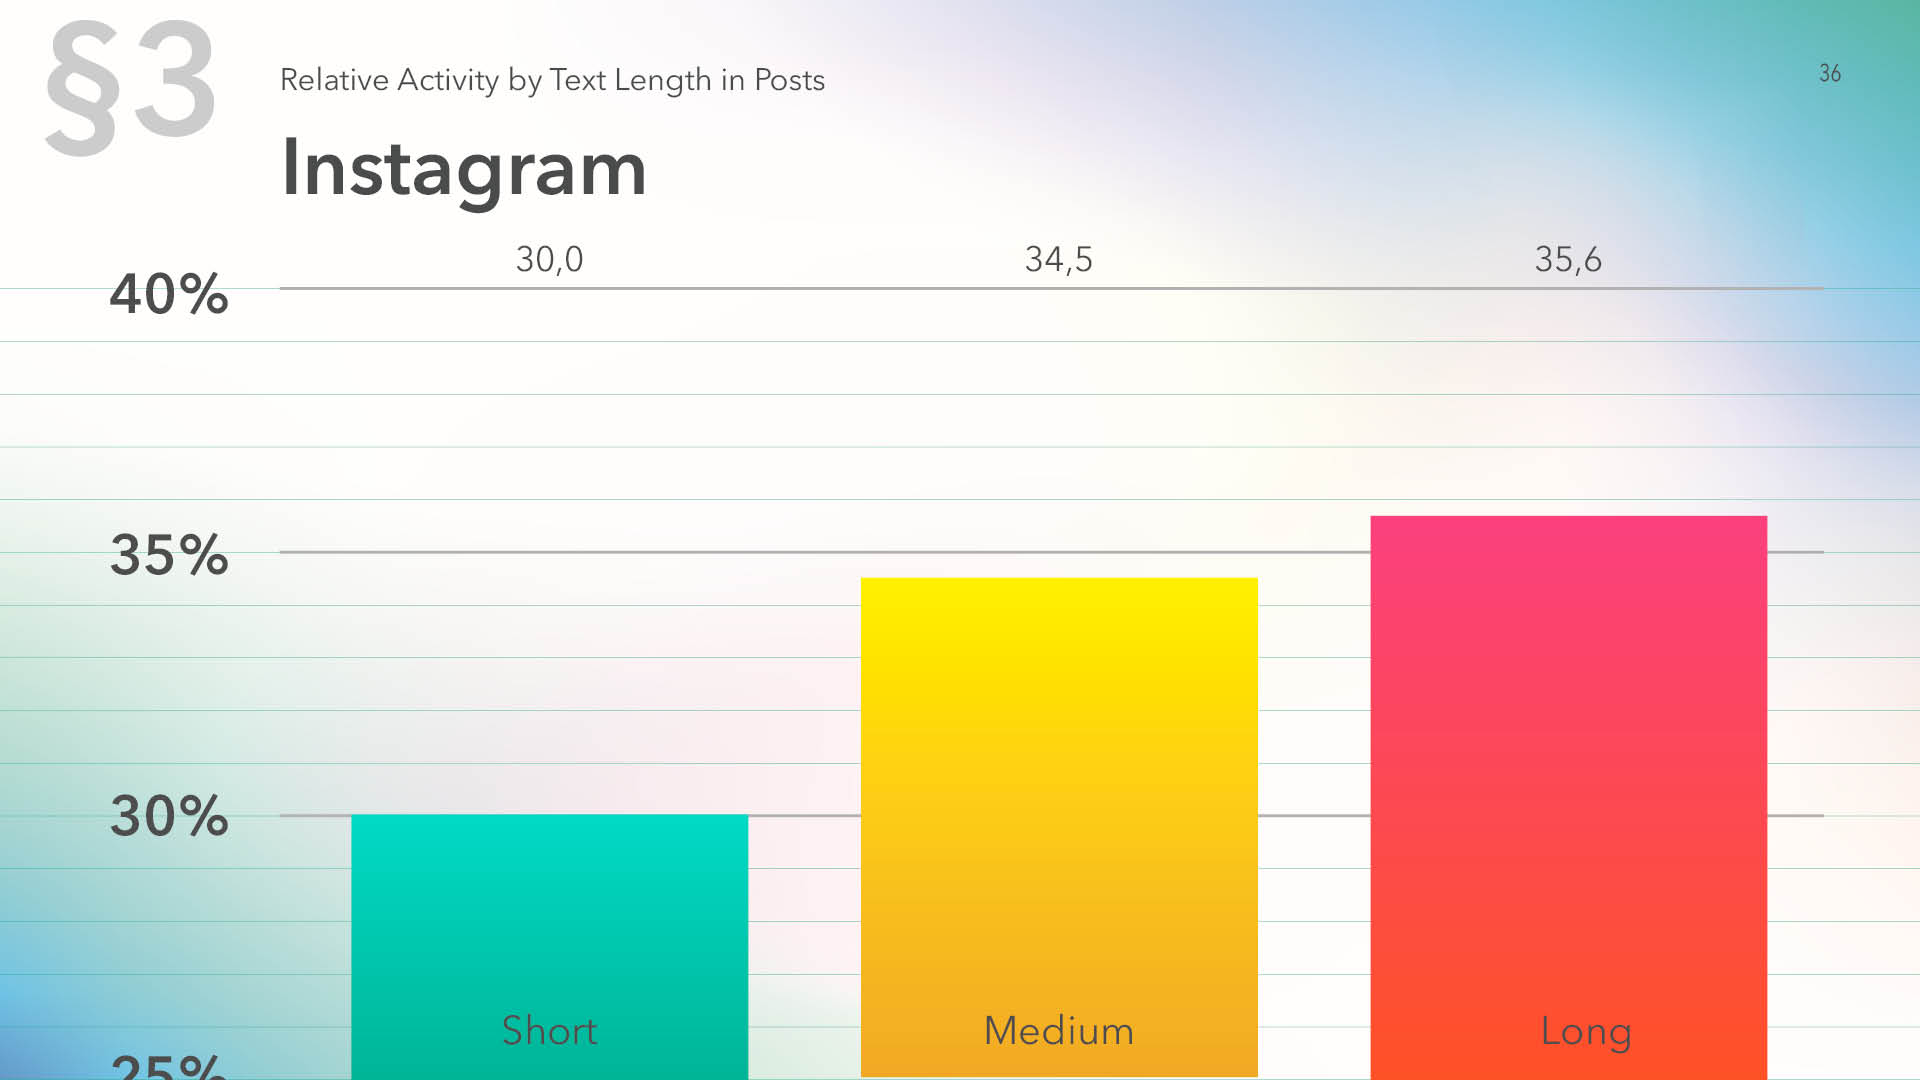
Long descriptions are leading on Instagram — they receive 35.5% of all the activities. Medium-size posts receive 34.5% of activity and short ones show the least user attraction with 30%.
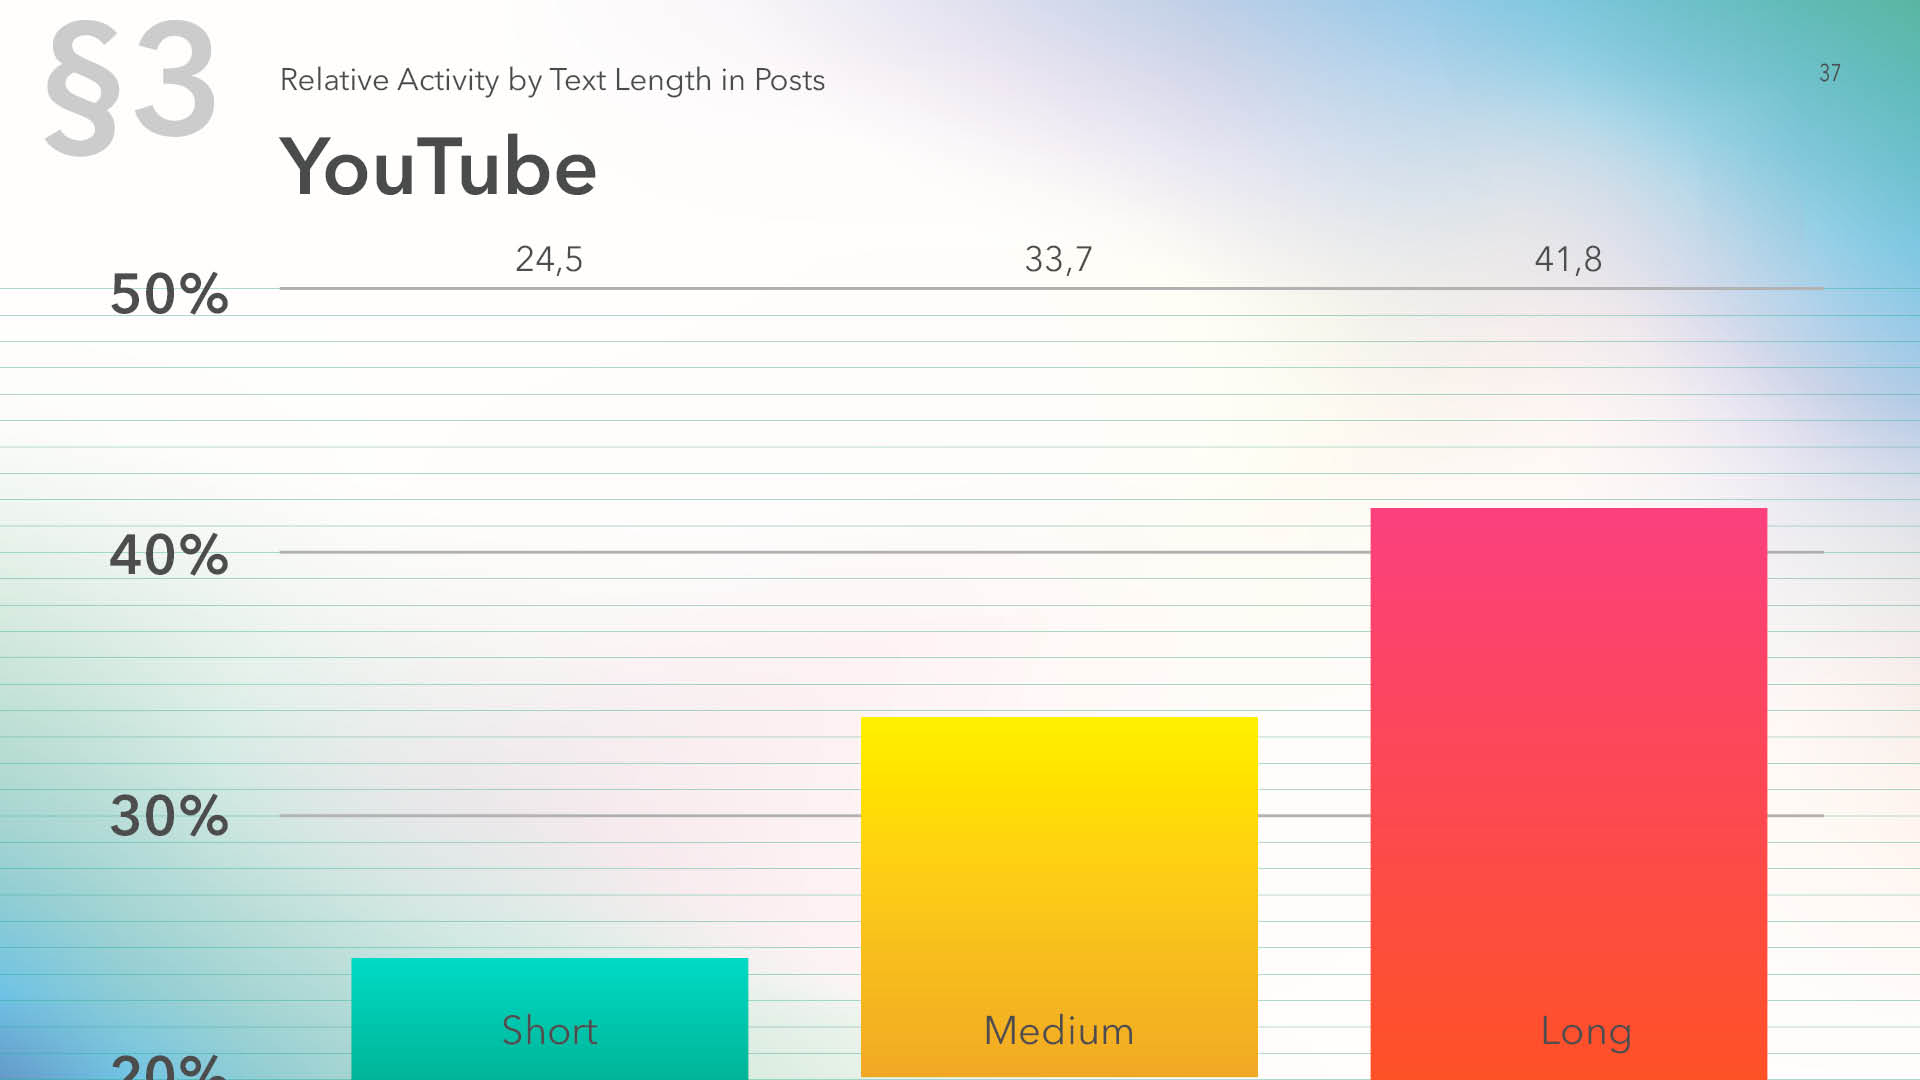
For YouTube, long descriptions are also leading (41.8%), while the lowest position in activity is taken by short descriptions with 24.5%.
VK audience is more active with short posts. Interestingly, medium and long posts have equal activity shares.
OK has the highest activity on short posts and the lowest activity on long posts.
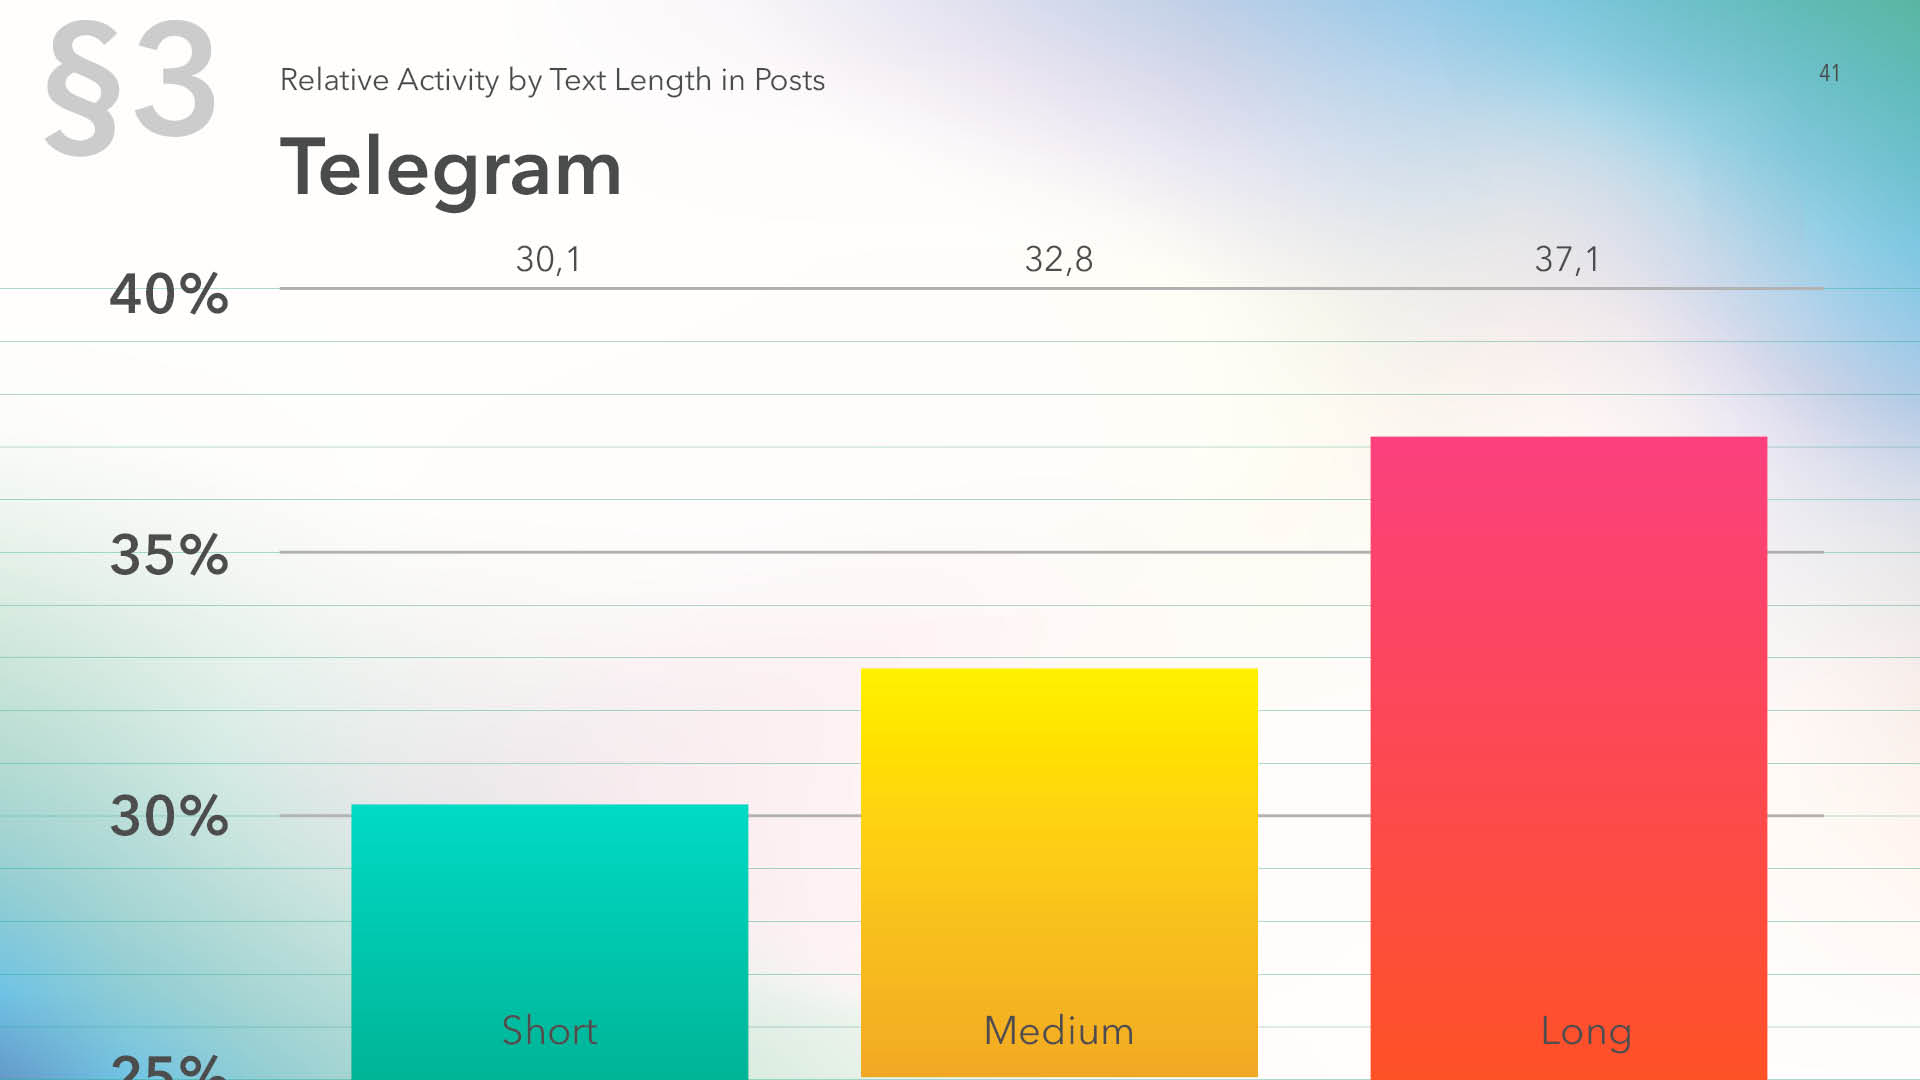
On Telegram, more activity is received by long texts, which have 37.1% of all activities, while medium-size texts received 32.8% of reactions.
On Tumblr, short texts are leading, while long texts receive the least share of activities.
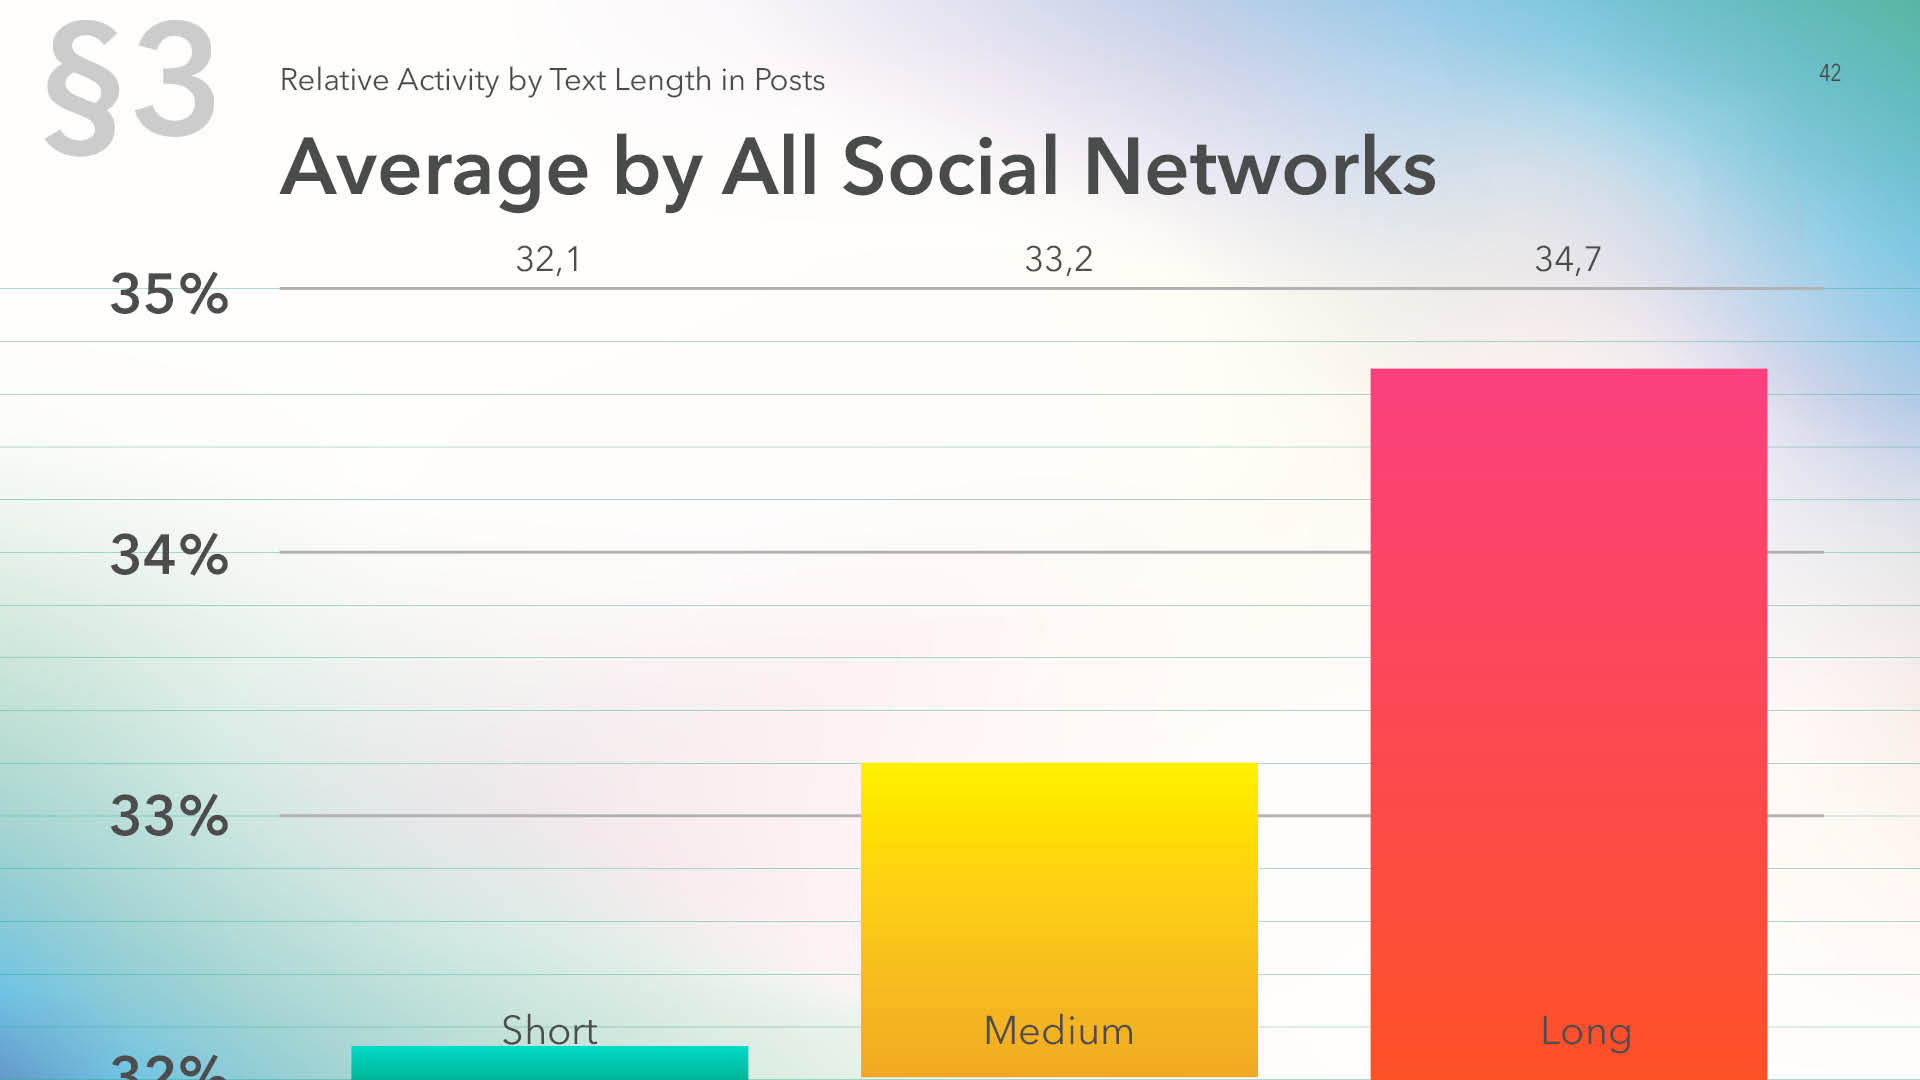
On the average for all the platforms, long texts are more popular, with 34.7% of all activities. Medium-size texts received 33.2% of reactions and short texts — 32.1%. It is natural that activities for long texts on sites with prevailing entertainment component (OK and VK) are noticeably lower.
Text Length vs Day
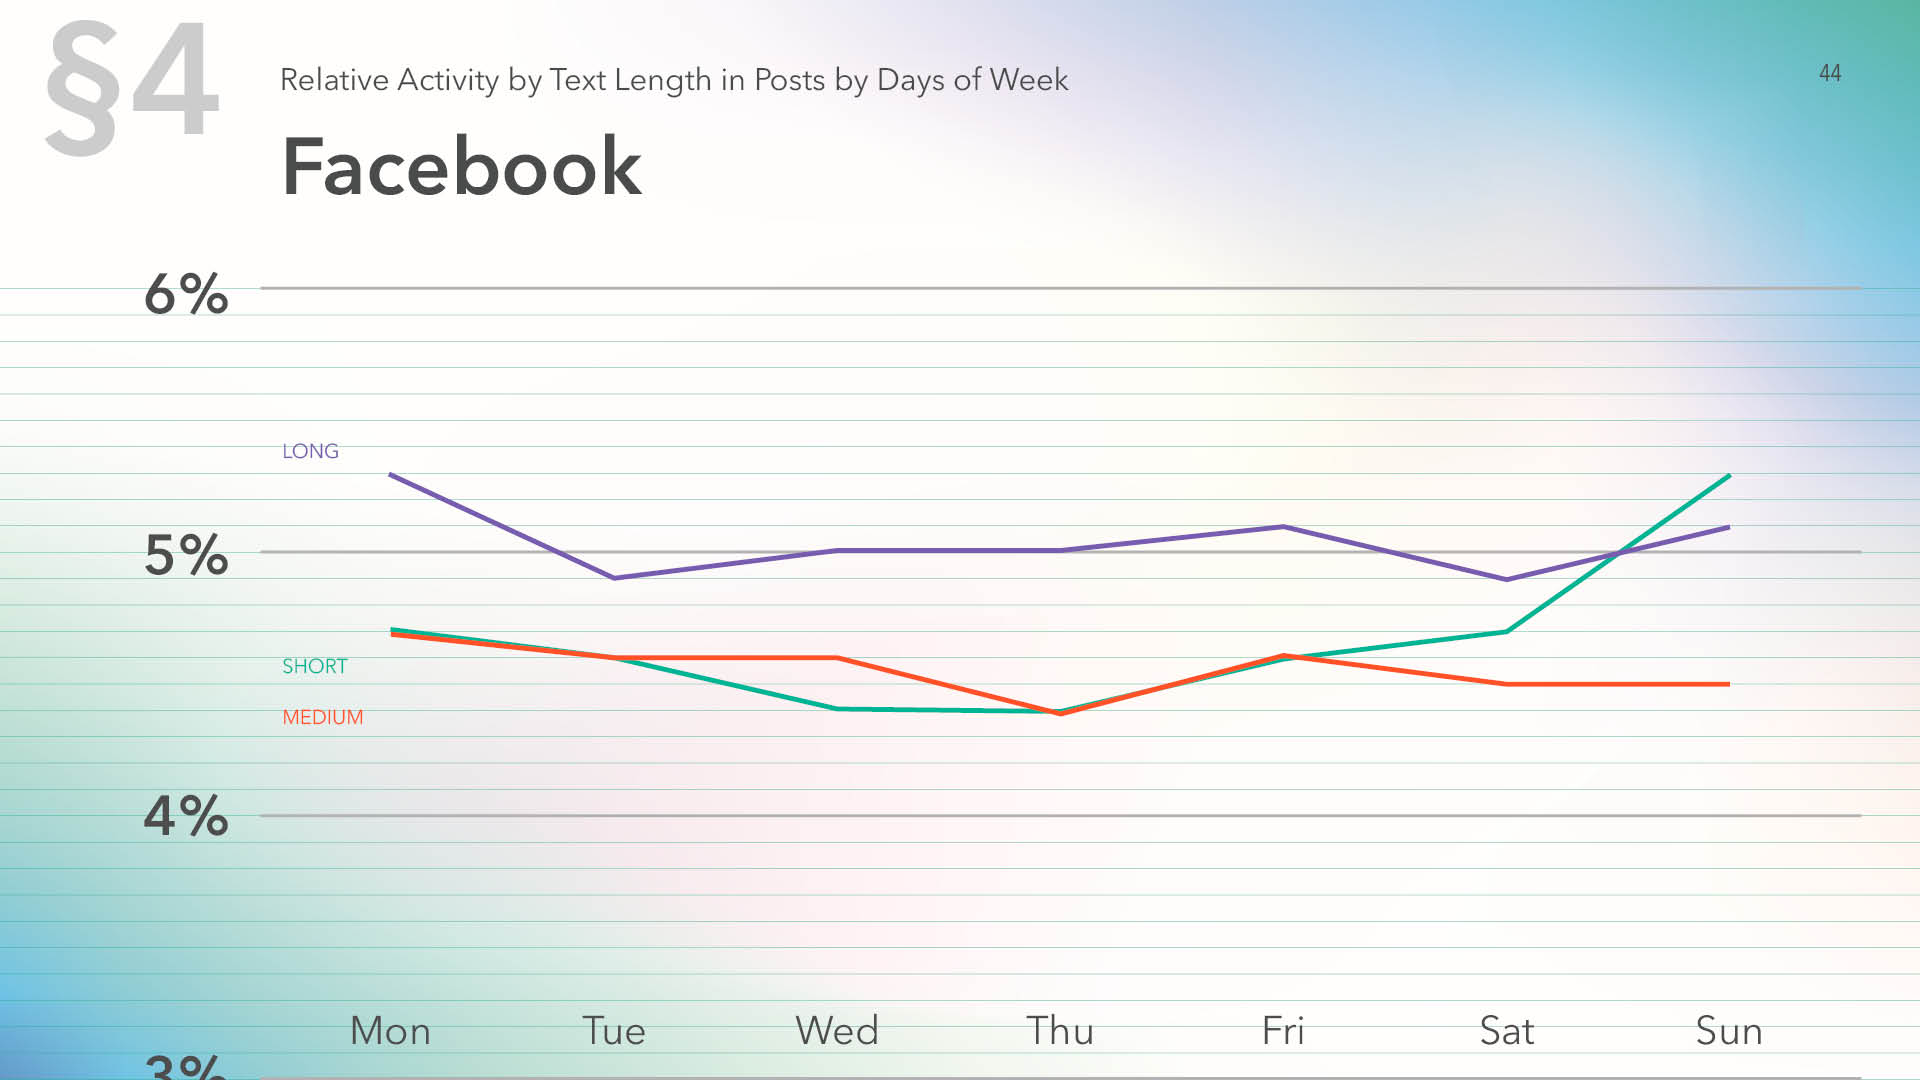
Long texts on Facebook receive more reactions during a week and it is only Sunday when they are outperformed by short texts.
For both Instagram and YouTube, the popularity of a certain text length is unaffected by day, with long descriptions leading consistently.
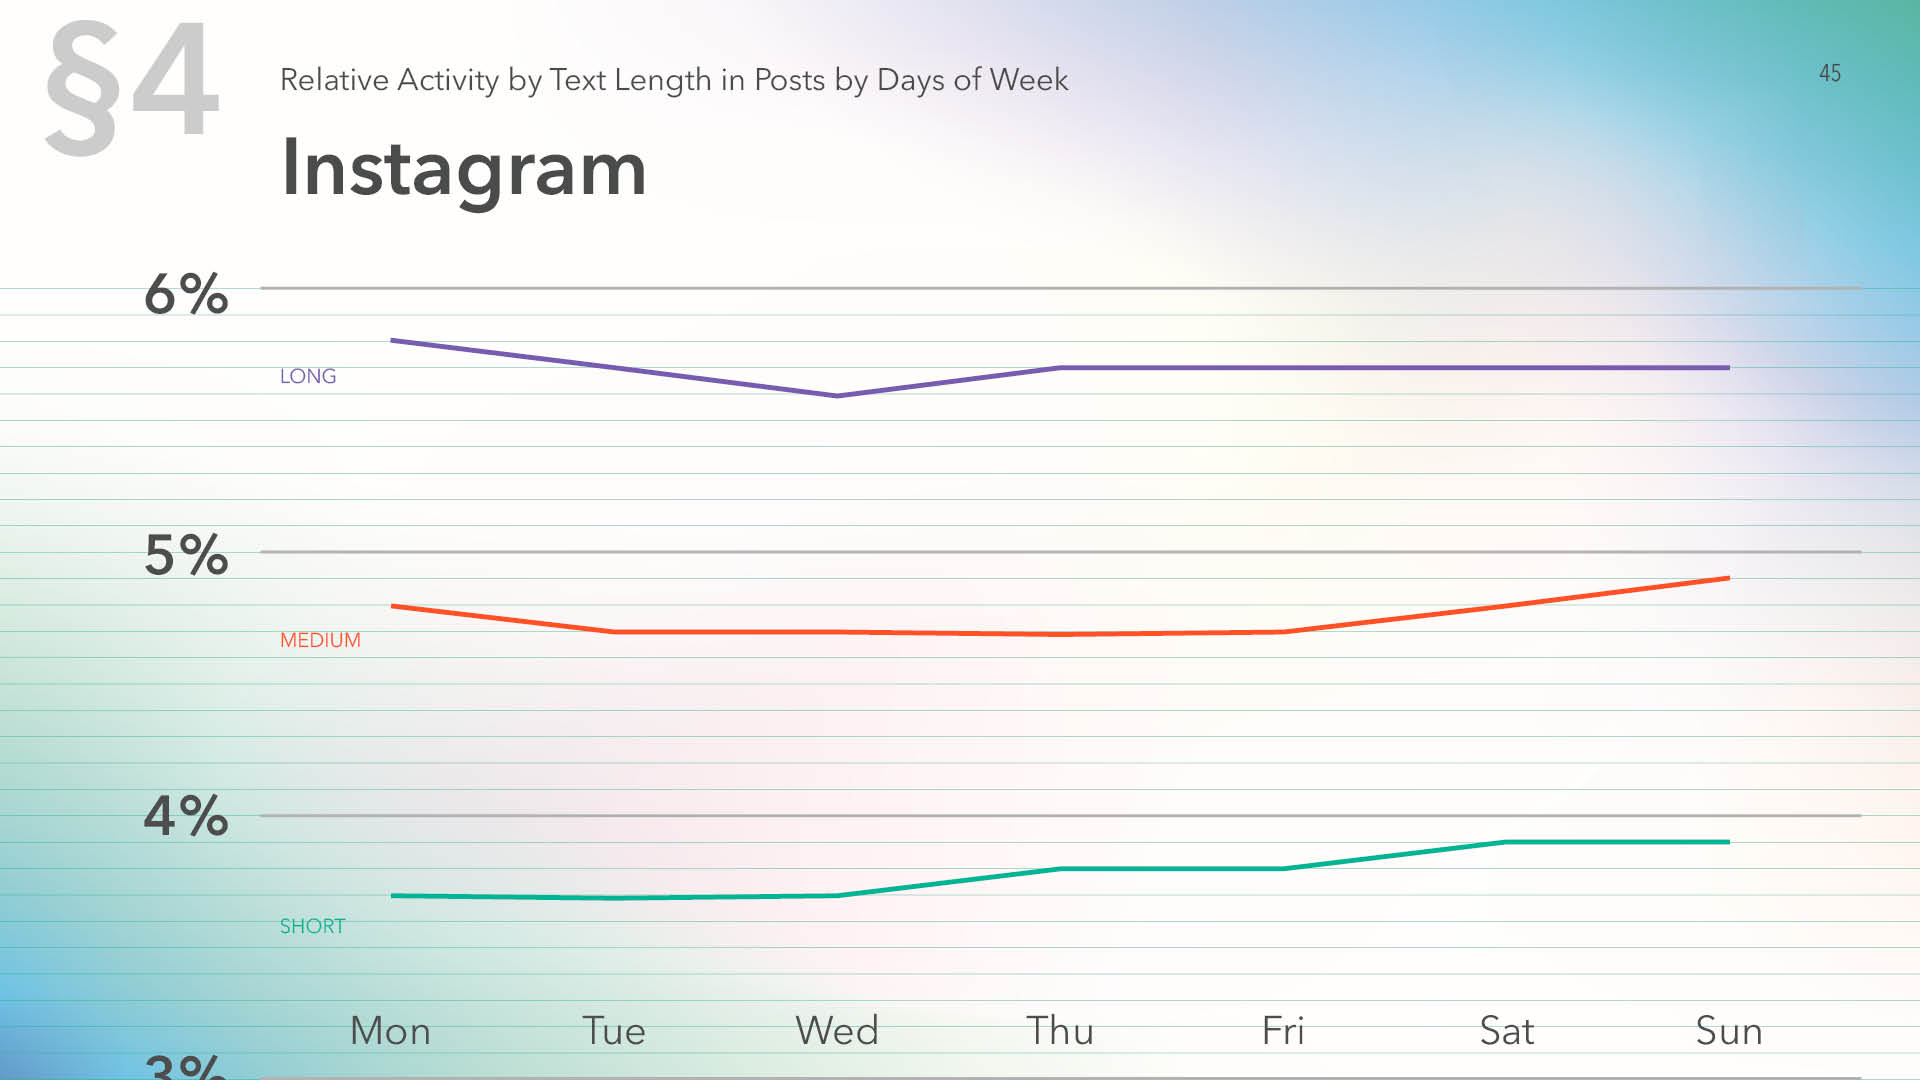
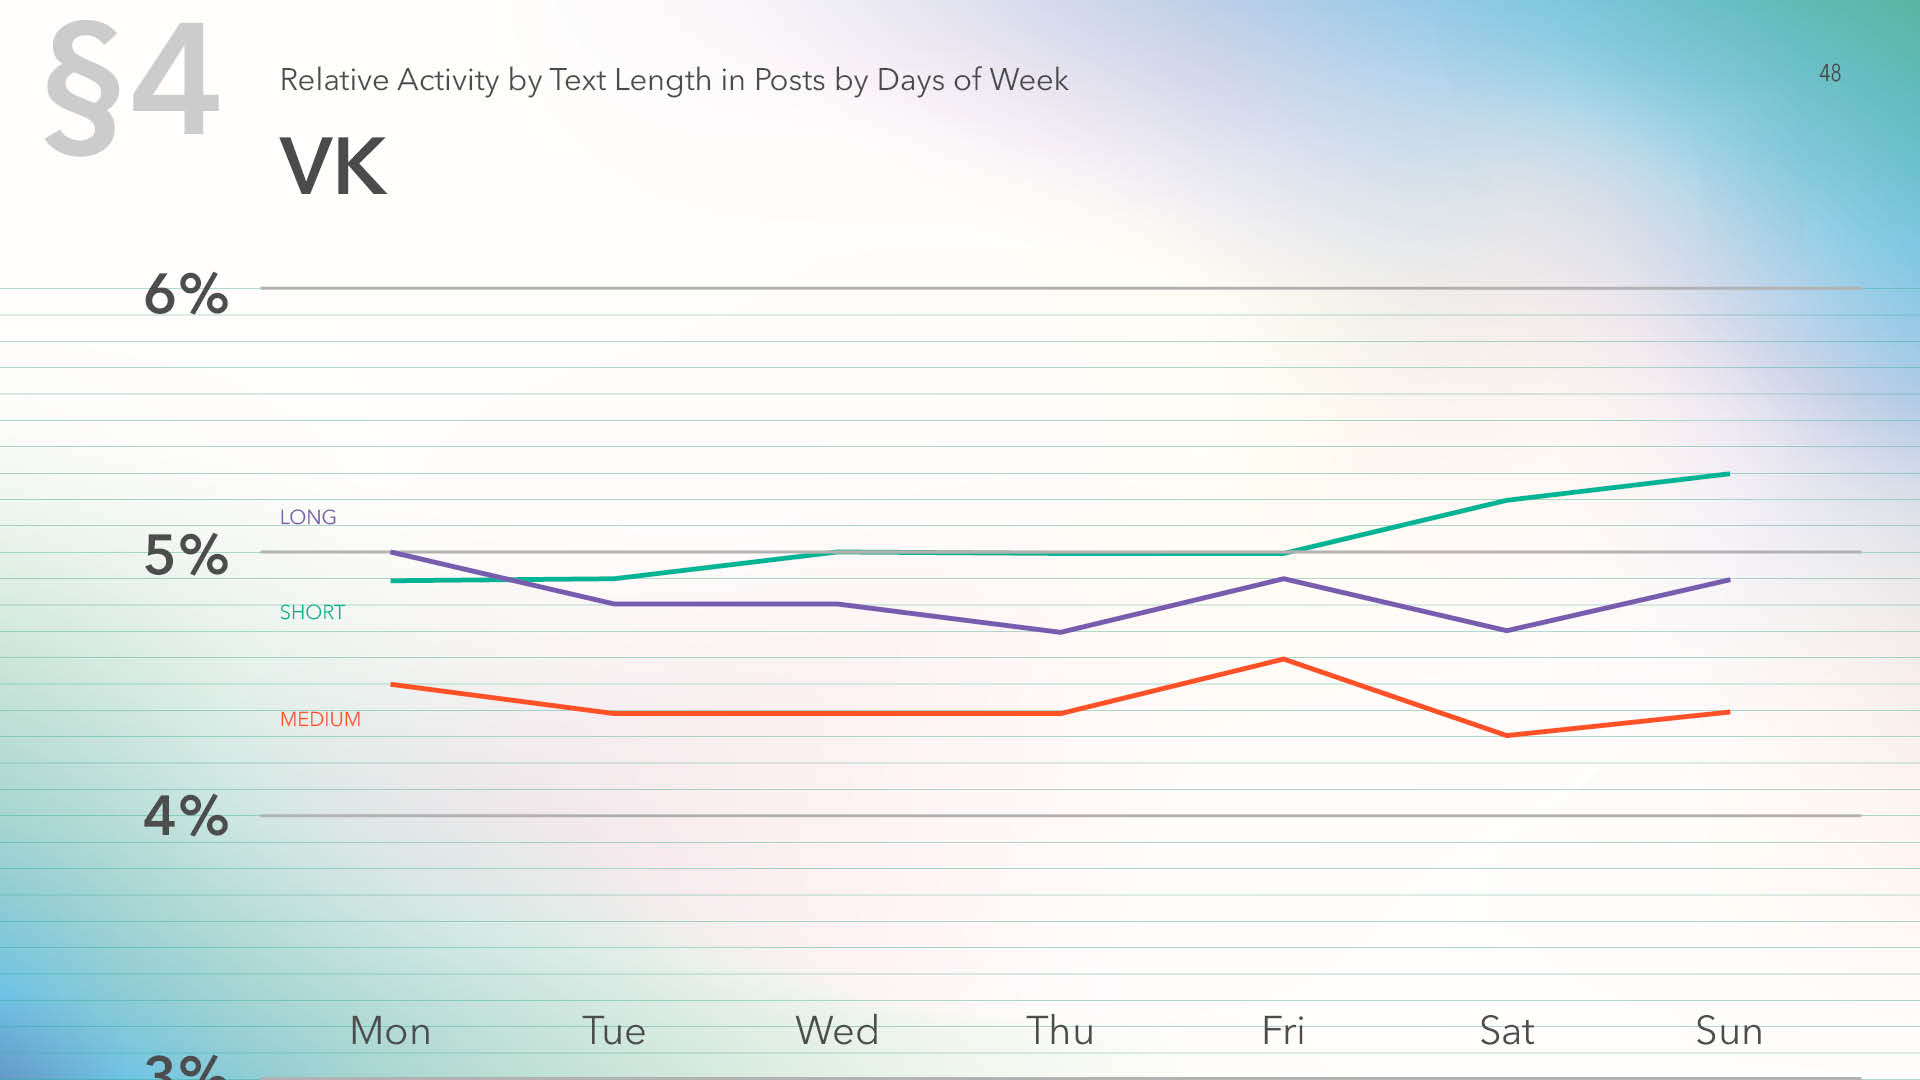
VK sees higher activity for short-text posts during weekends, with long texts leading on Monday.
For OK, short texts lead during a week but Friday sees a sharp increase in the interest in long-reads.
Telegram has stable higher engagement for long-reads during a week, with a minor decrease during weekends, however not affecting their leadership.
On Tumblr, long texts are leading on Monday and then, during a week, the interest in them decreases and short texts receive more engagement.
On the average for all the media, long-reads are leading in engagement during a week. The interest in them shows a minor decrease on weekends. Short texts are outperformed by medium-size texts during a week but gain more reactions on weekends.
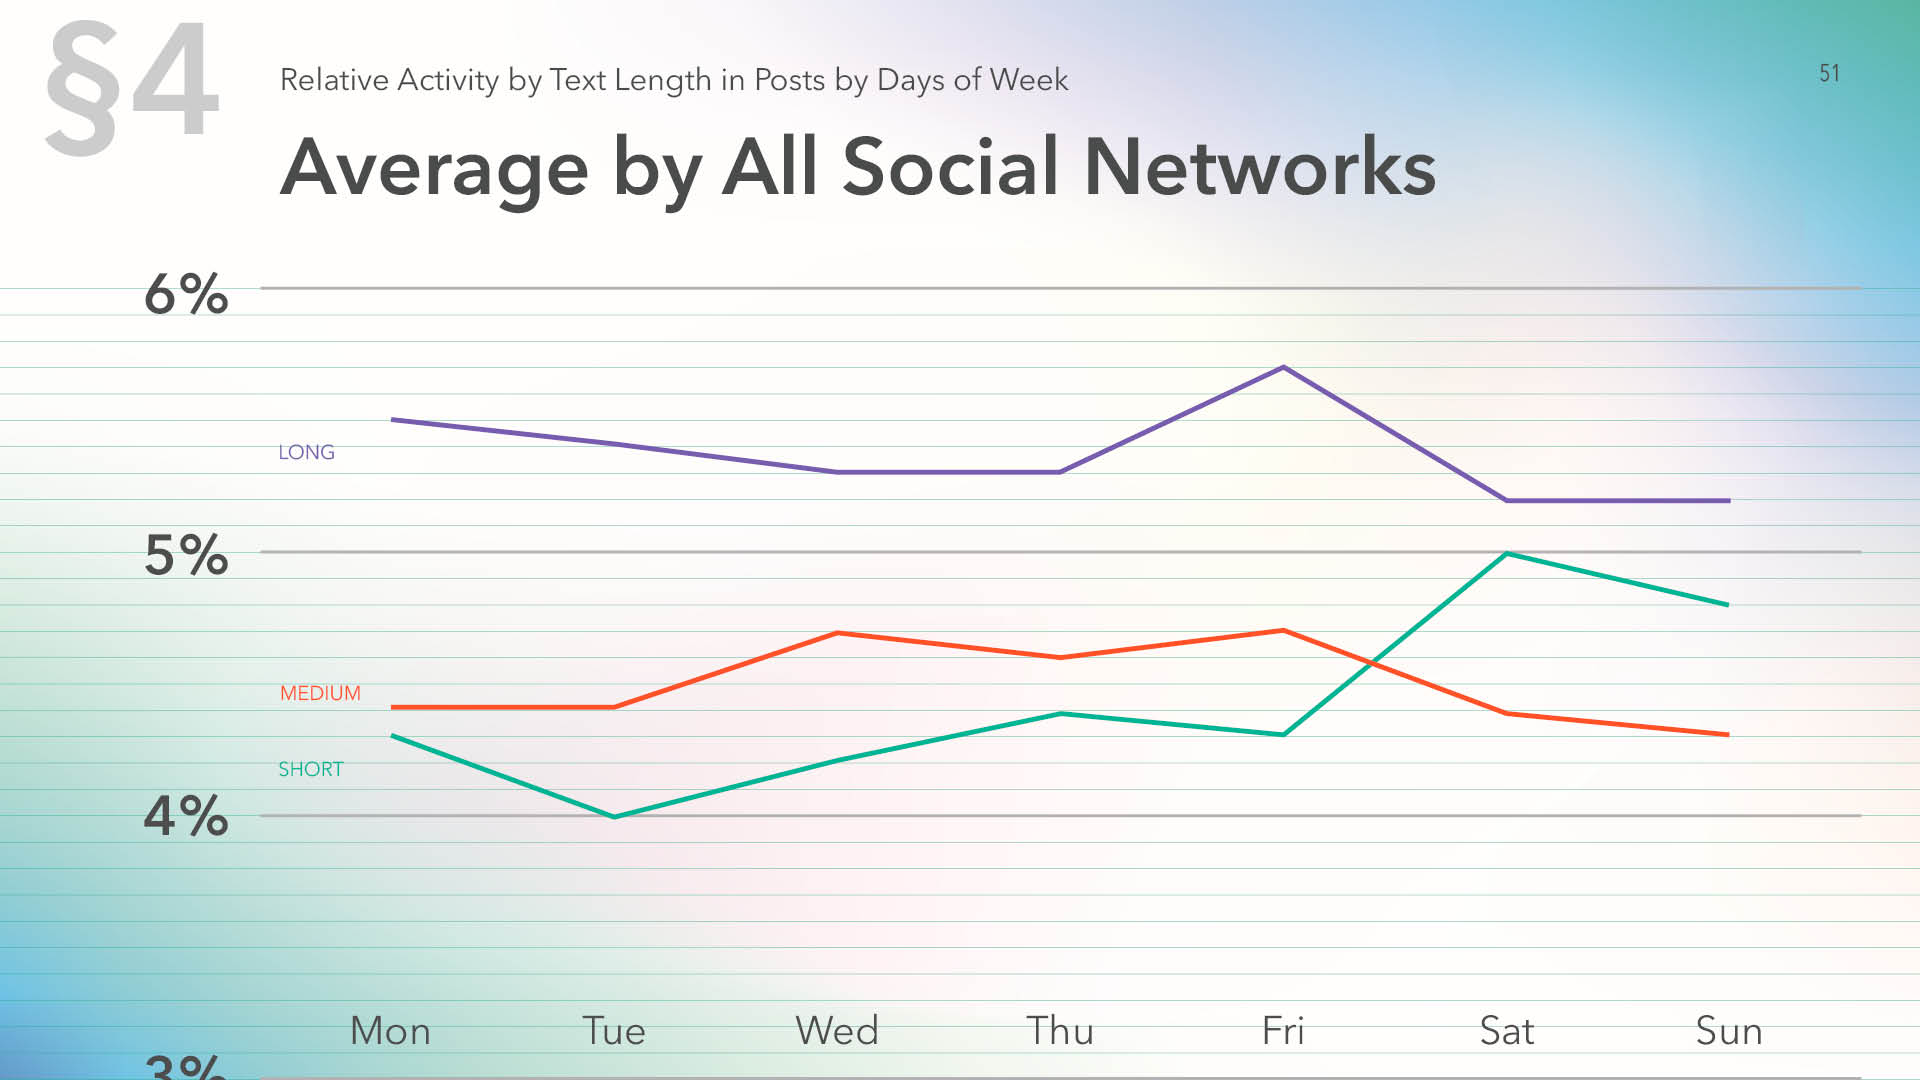
Higher interest in short posts on weekends remained trending from 2018 when the study showed a similar result.
Text Length vs Hour
During a day, the interest in long-reads grows at 5 a.m. and 11 p.m.
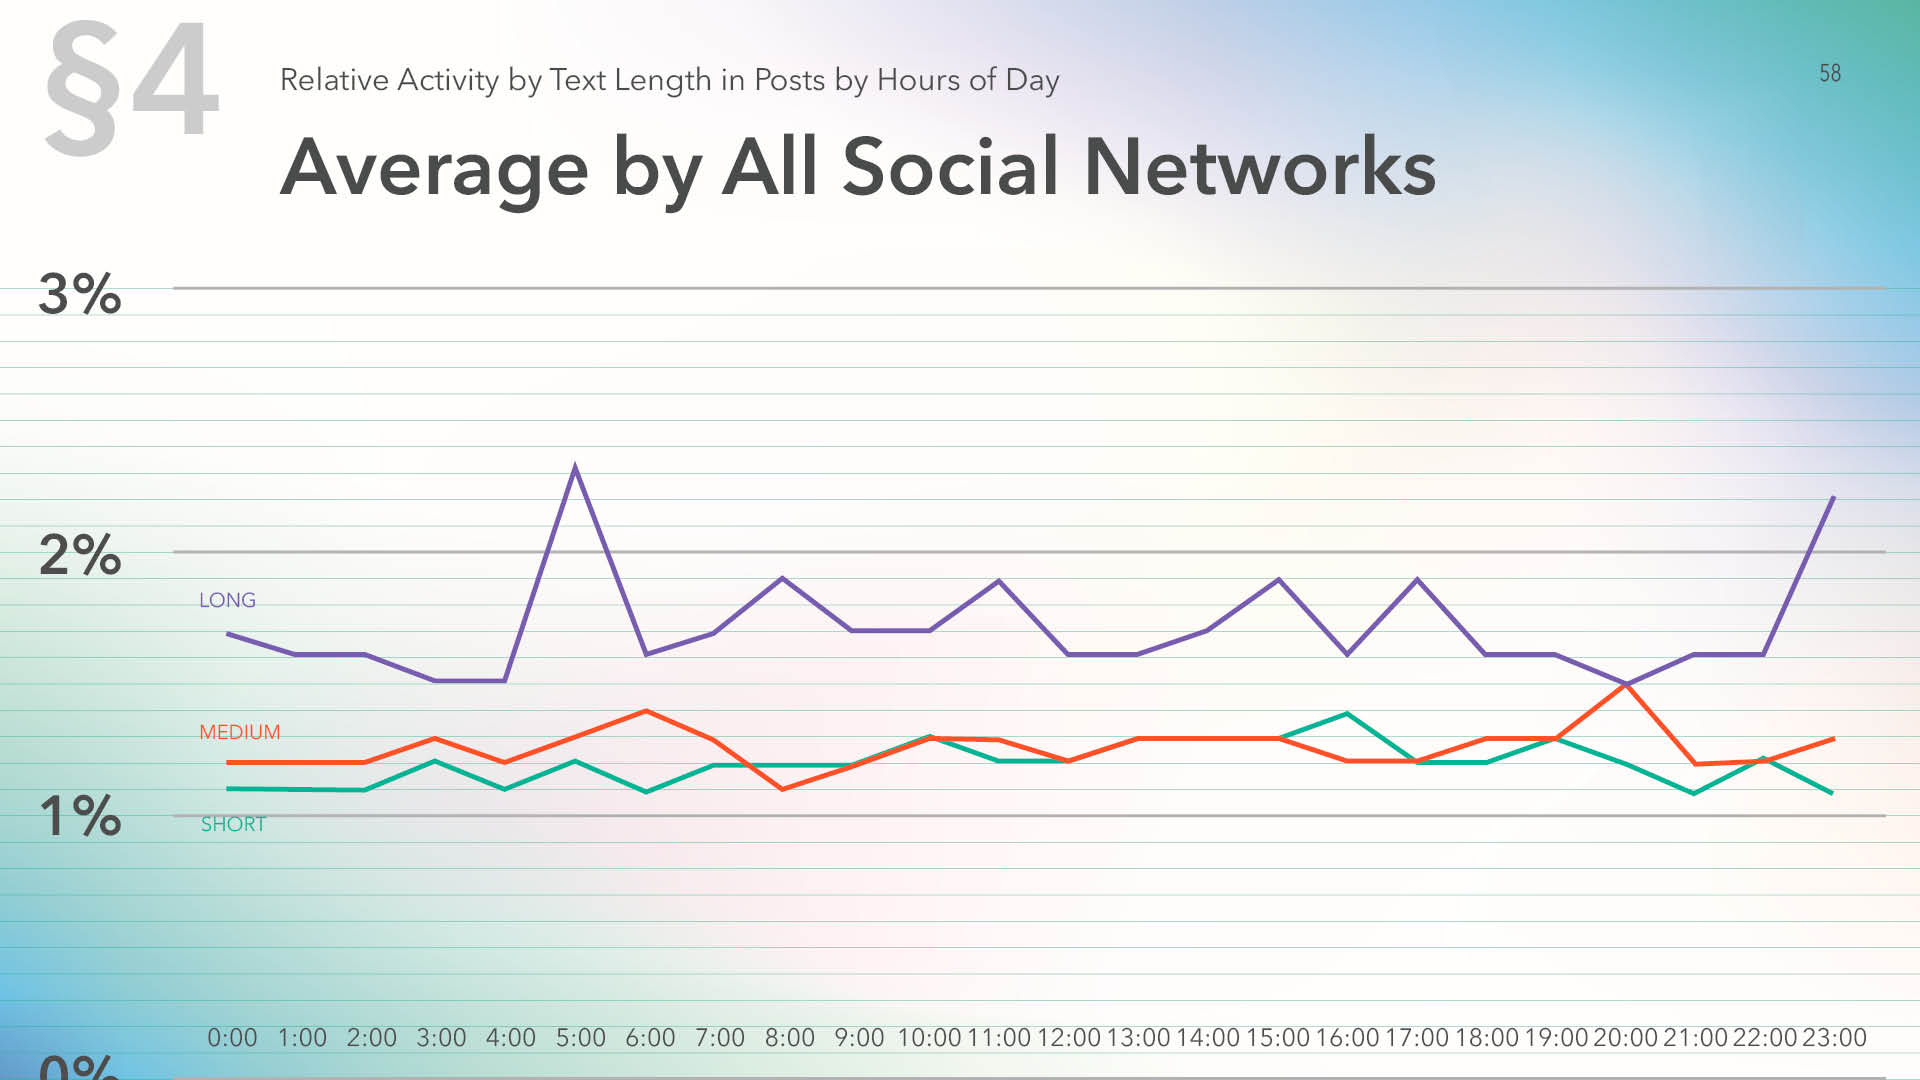
The engagement for short texts increases insignificantly in the afternoon. The peak interest in medium-length posts is at 8 p.m.
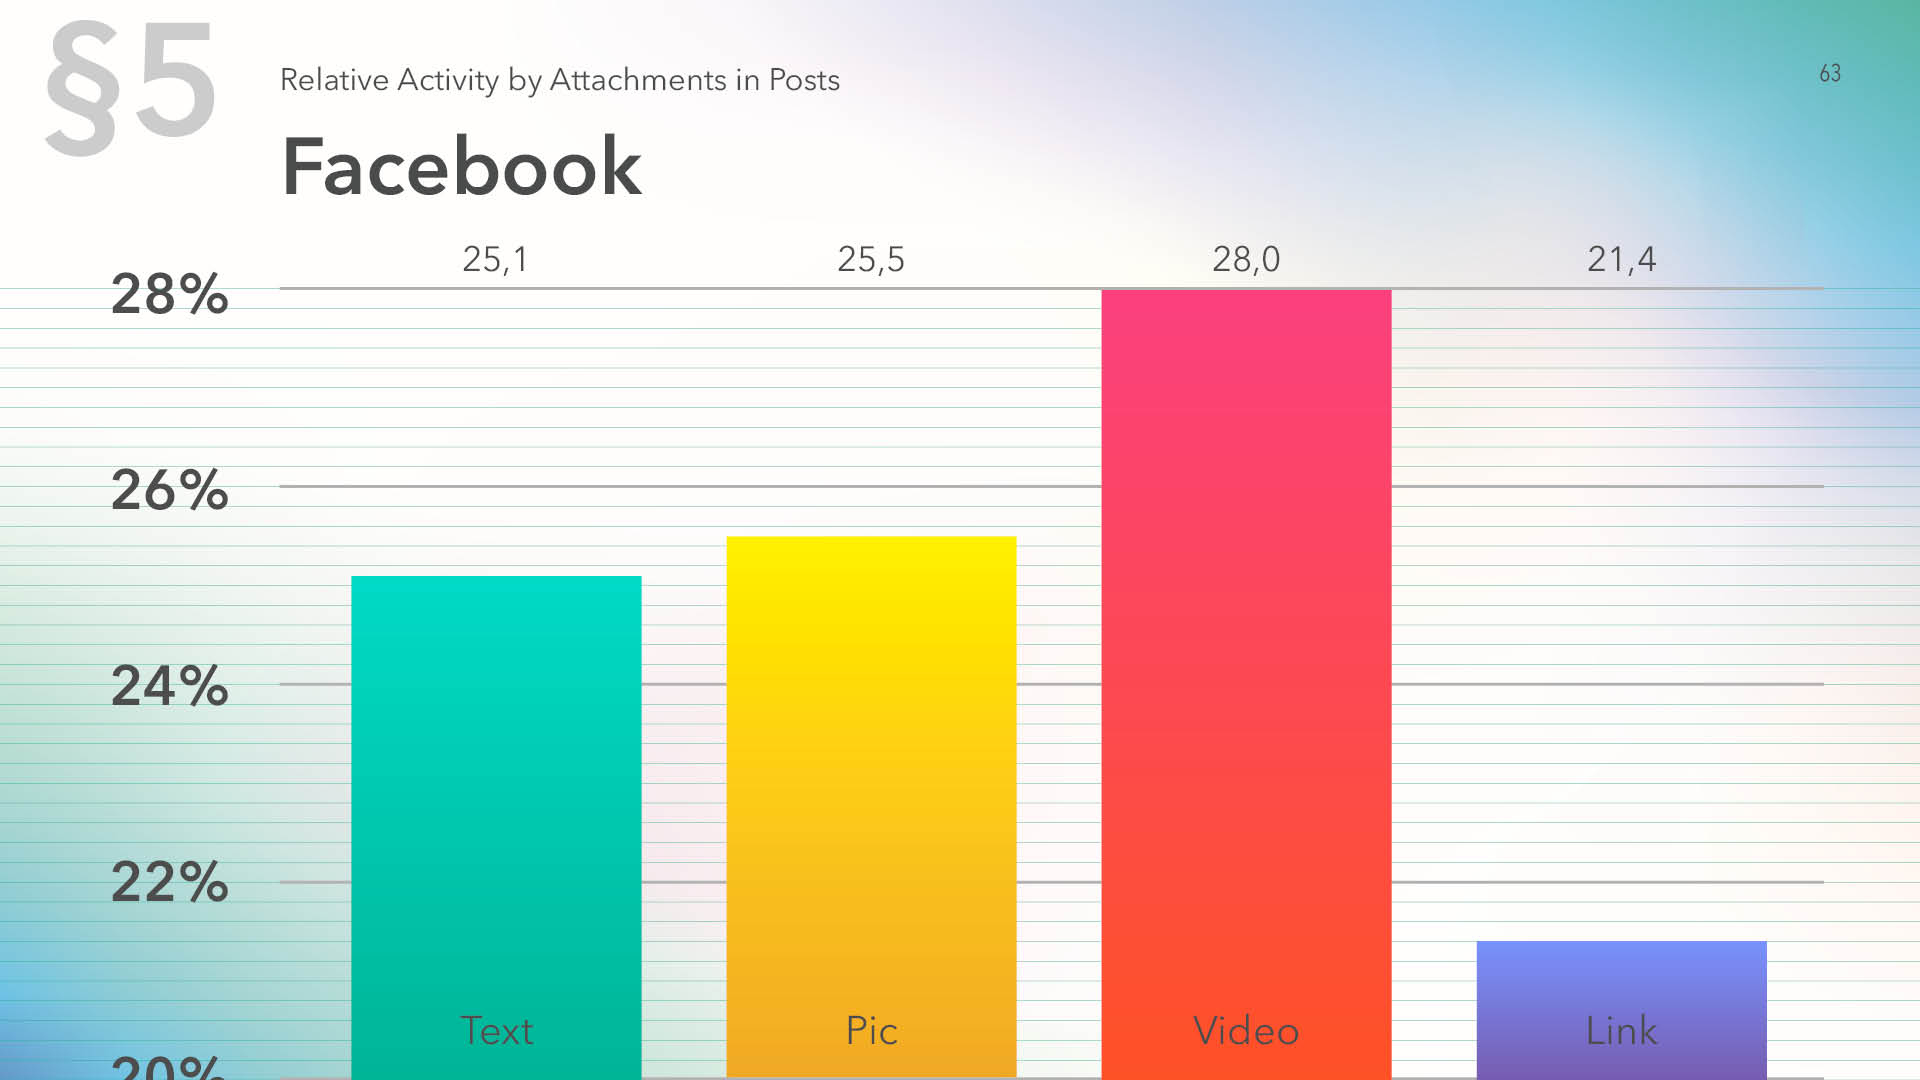
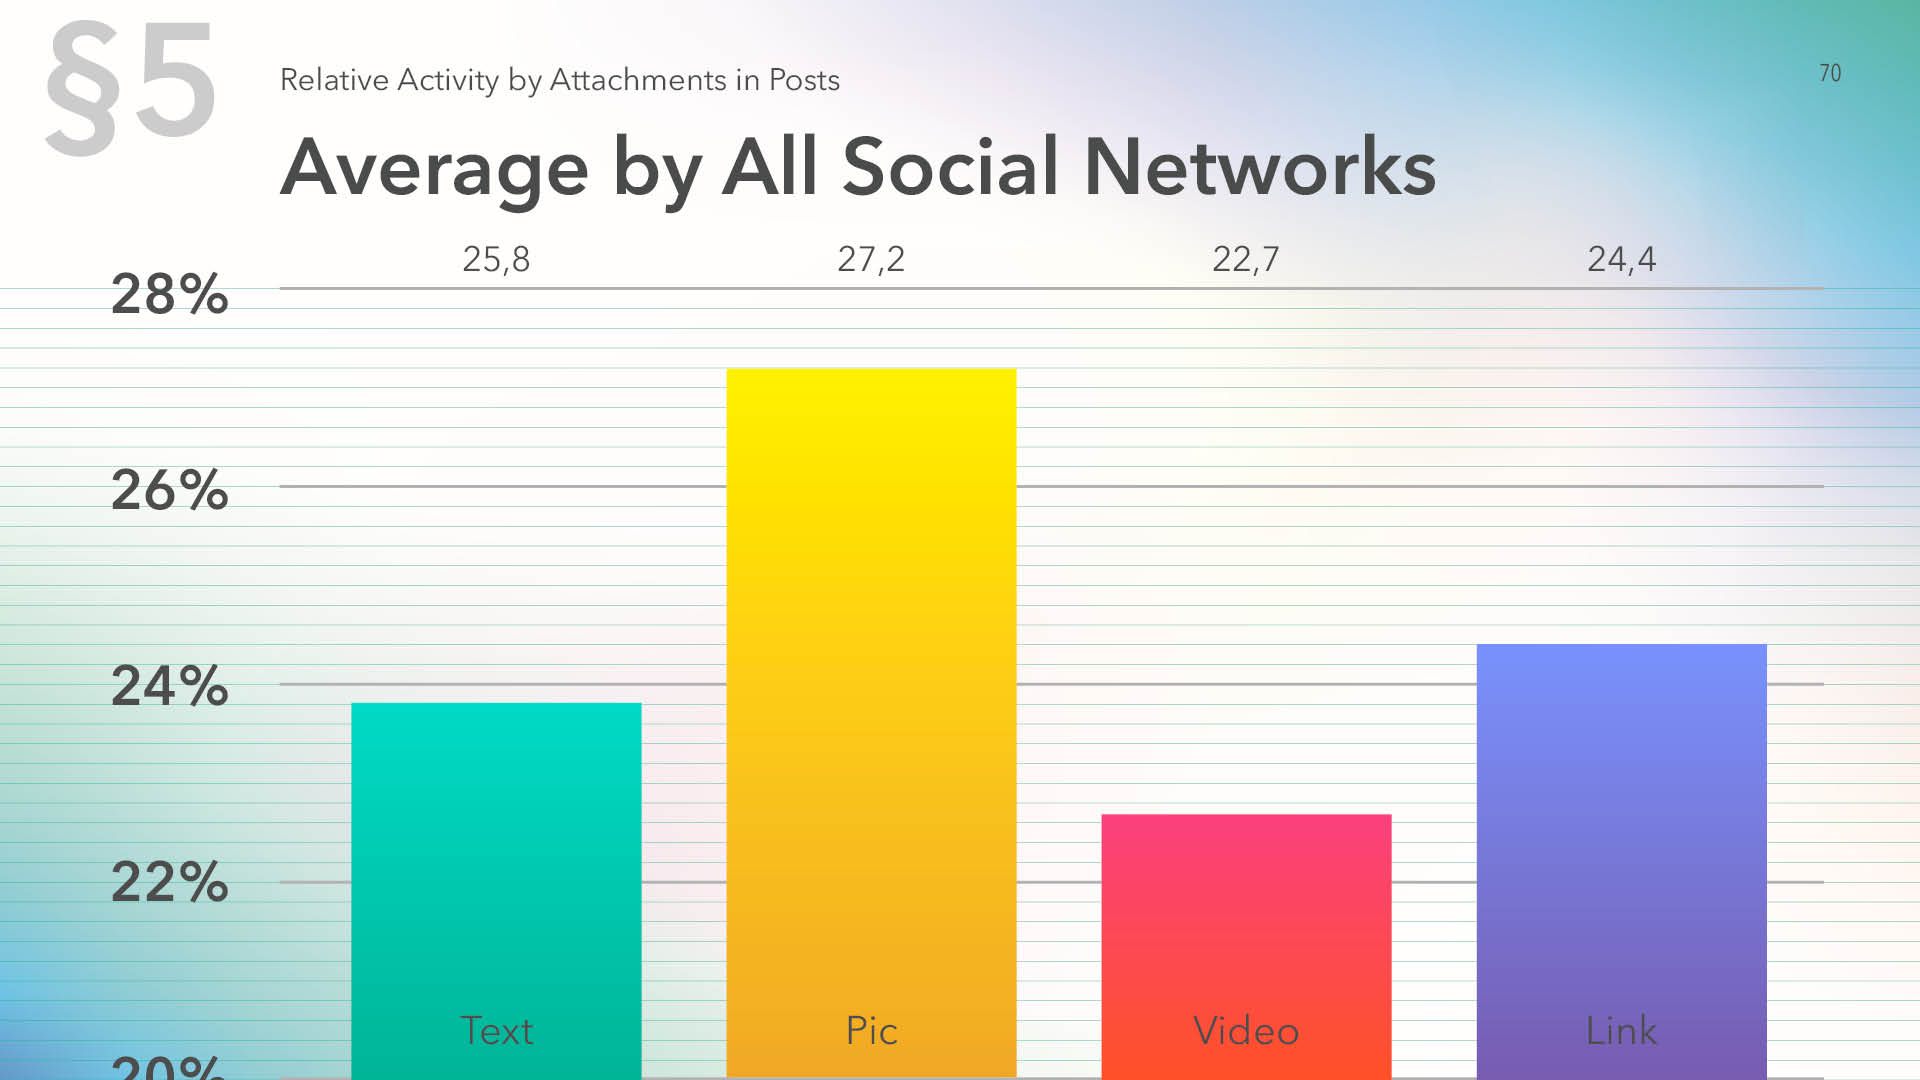
Audience Activity by Content Type
The tool categorizes all posts by attachment type (picture/video/text/link). If a post includes several elements, it is counted as an individual item for every content type.
For Facebook, posts with videos are leading, while the least share of engagement is with posts having hyperlinks. The gap between videos and other formats reduced noticeably during the year.
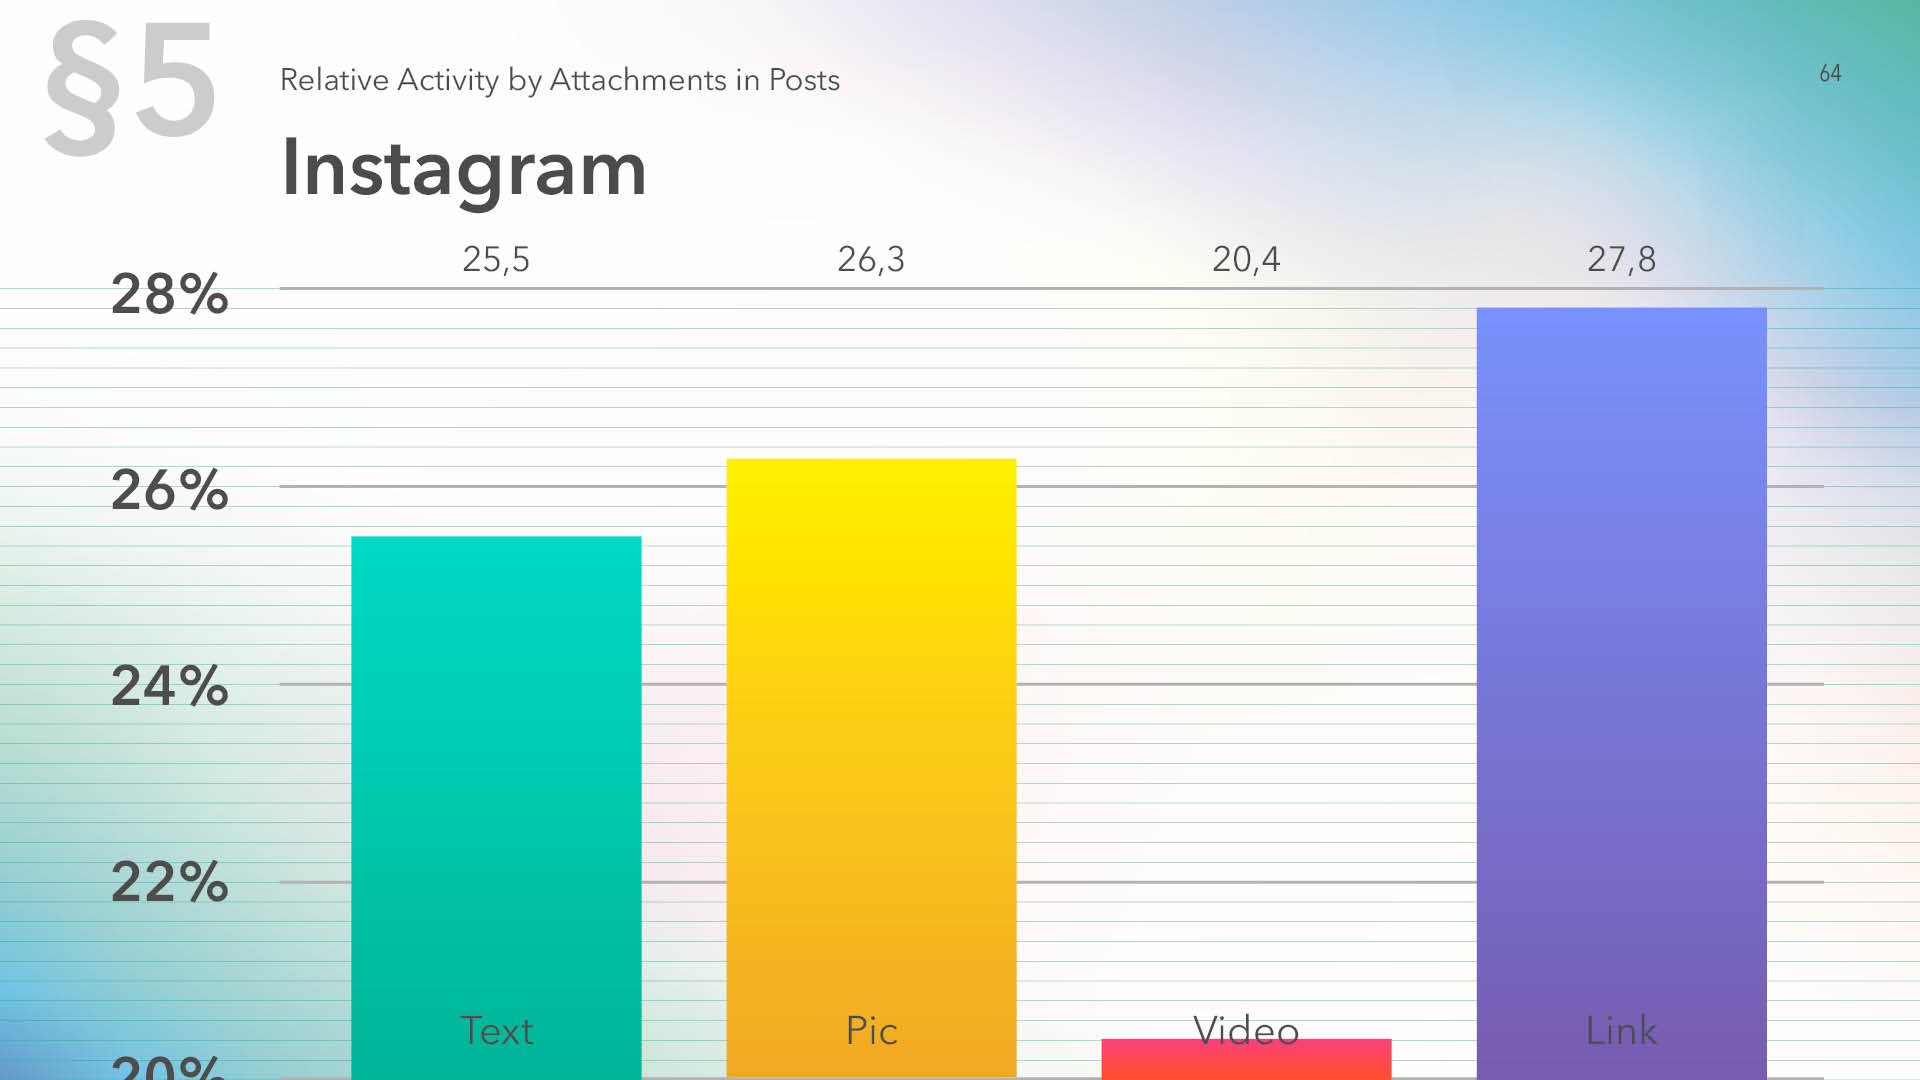
On Instagram, posts with links receive more engagement and pictures perform significantly better than videos.
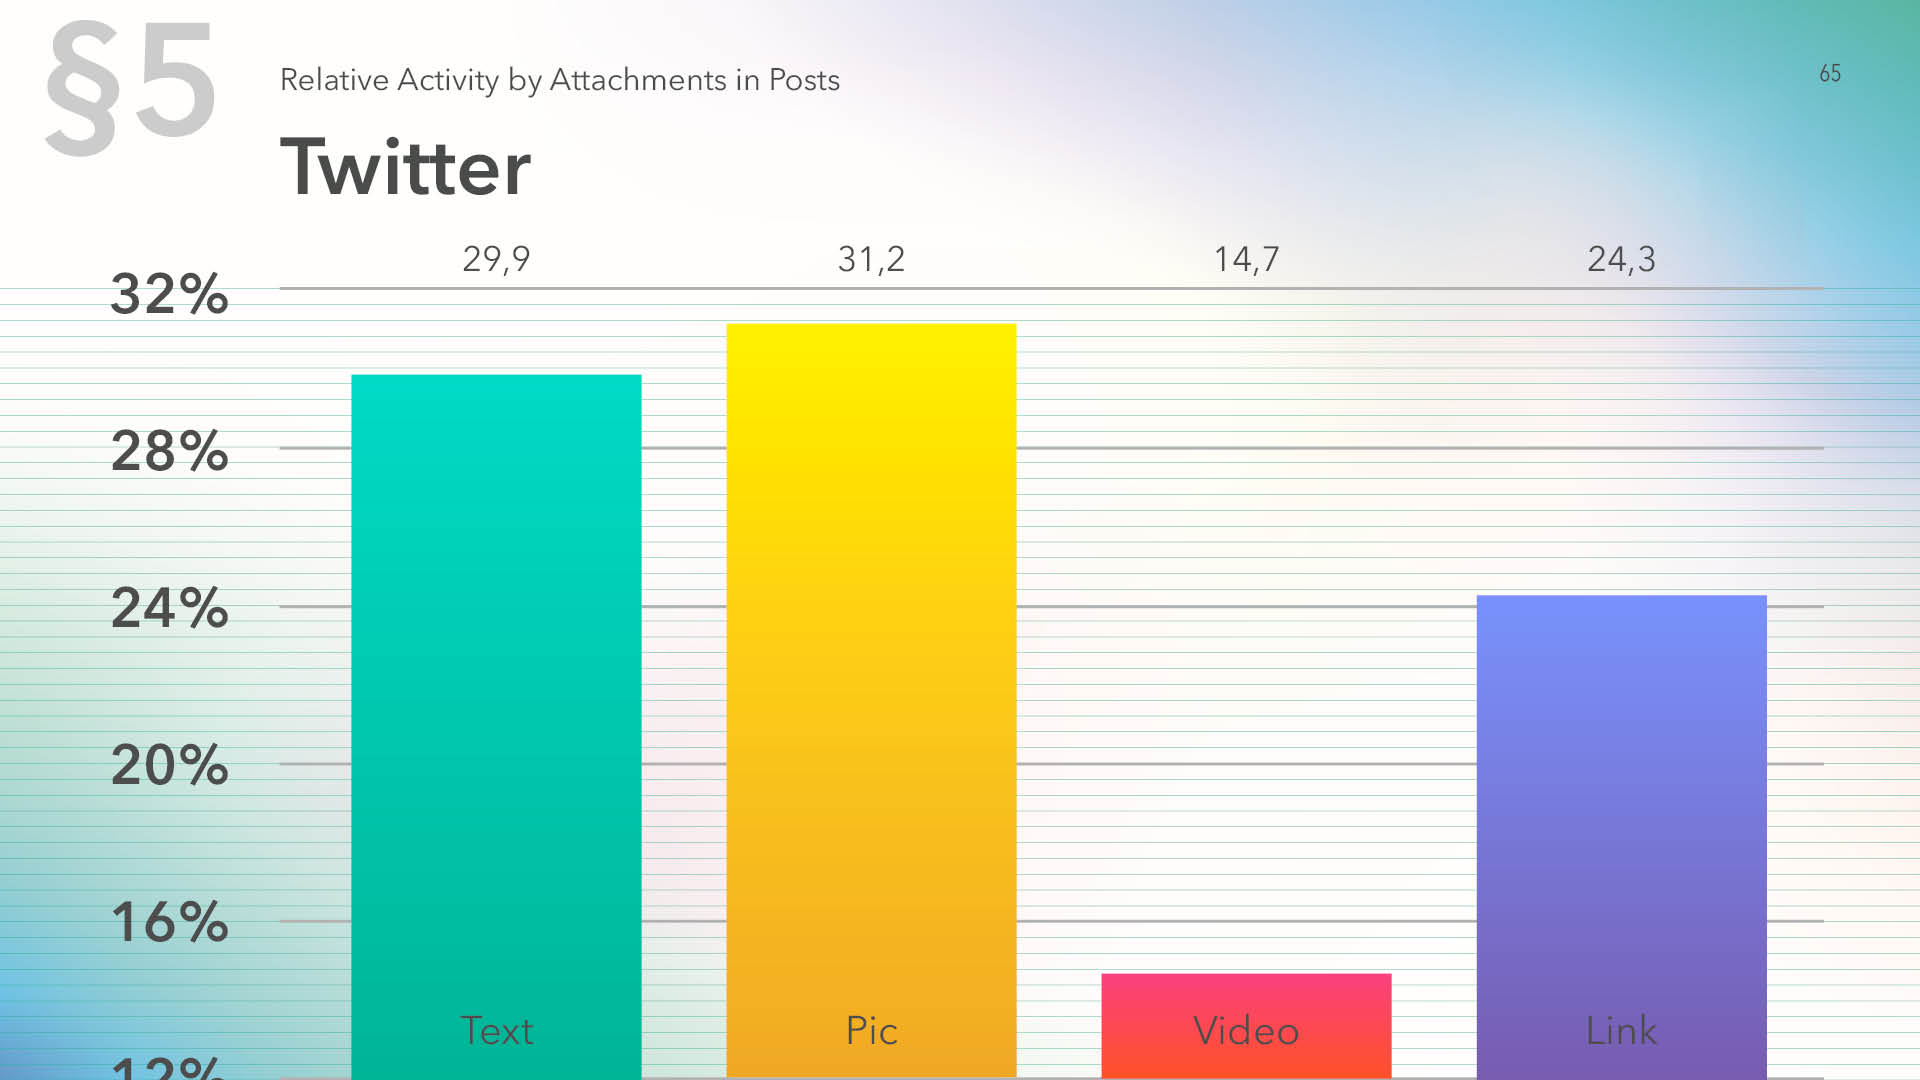
Twitter has more engagement with pictures and less with links.
On VK, posts with pictures enjoy more reactions. Posts with videos and links receive lower engagement.
Posts with links receive least reactions on OK as well. The leader is text, while pictures outperform video in engagement.
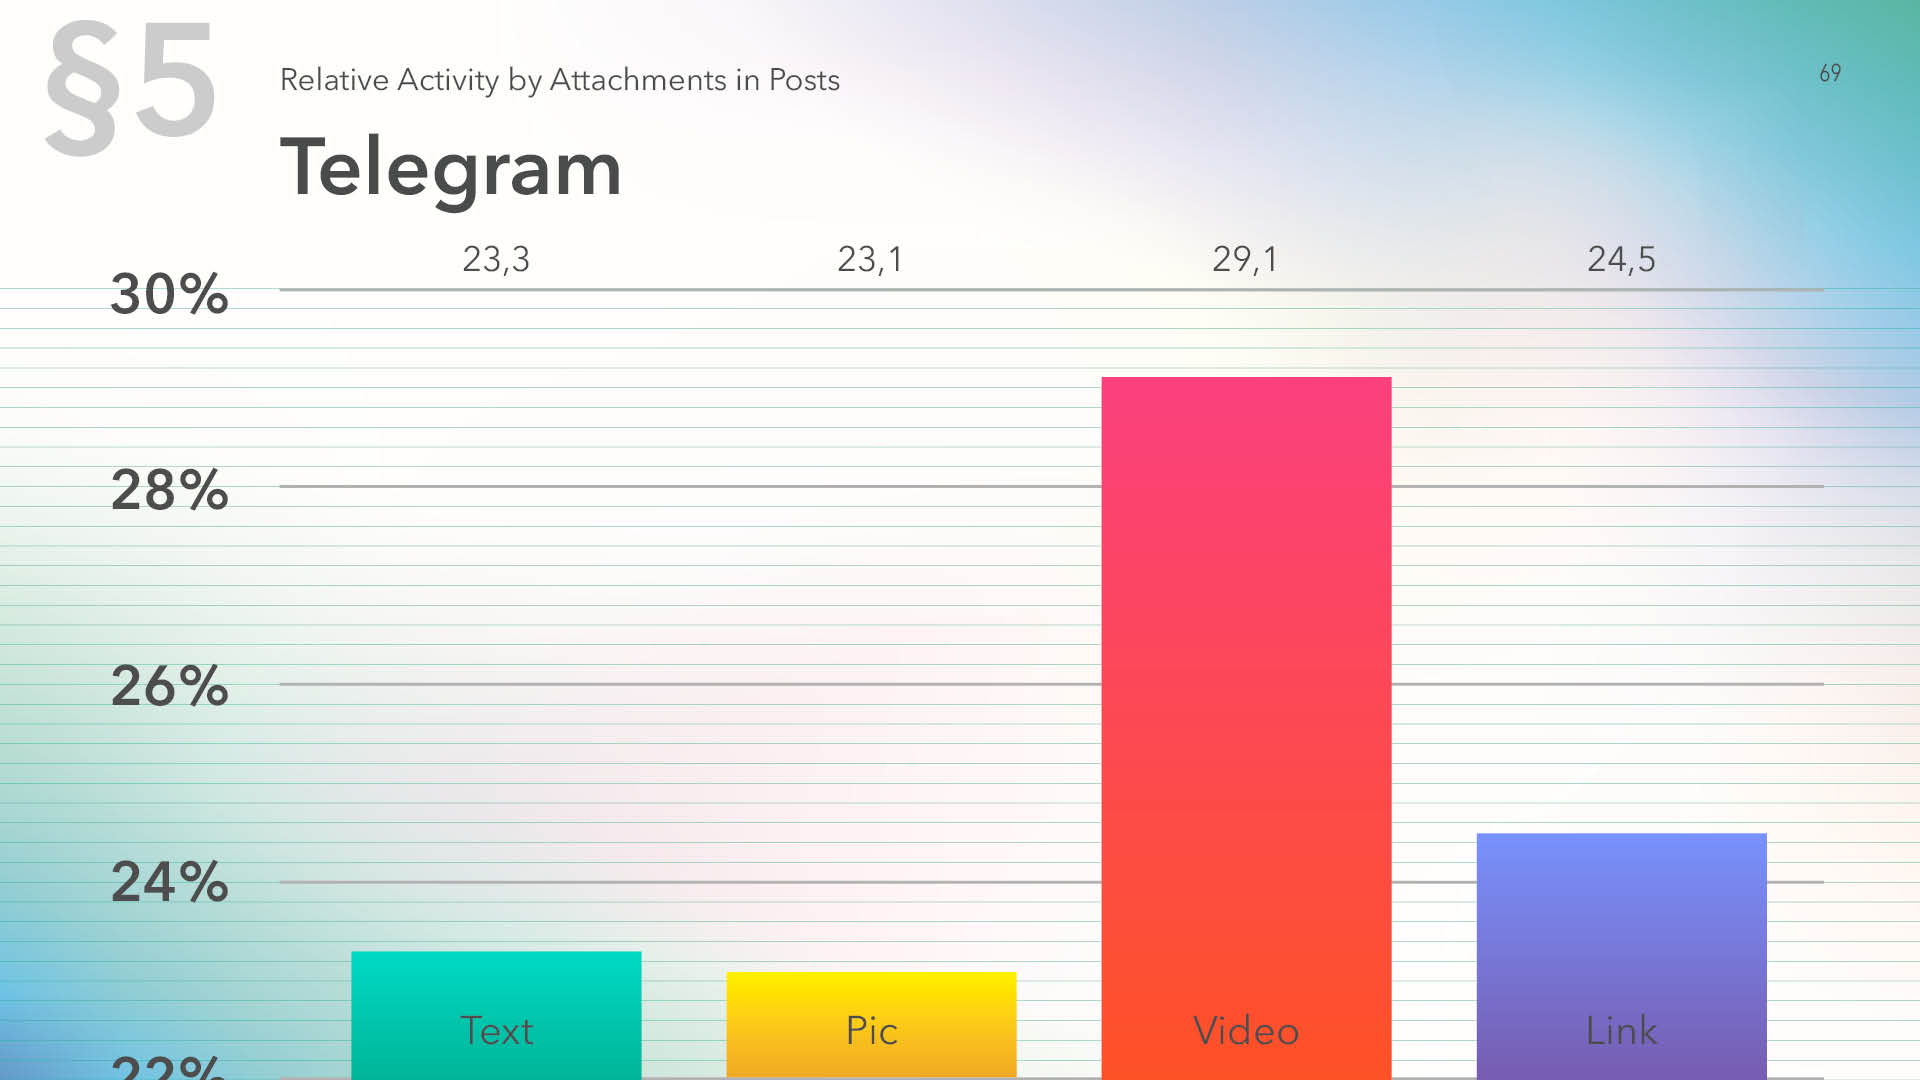
Telegram shows the best engagement for posts with videos, while pictures have the lowest position, not far behind text posts. Posts with links gets more engagement too.
On Tumblr, posts with links are leading, with videos receiving least reaction.
On the average for all the platforms, the highest engagement is received by posts that contain pictures. The lowest position is occupied by video.
Averaged Engagement Indicators
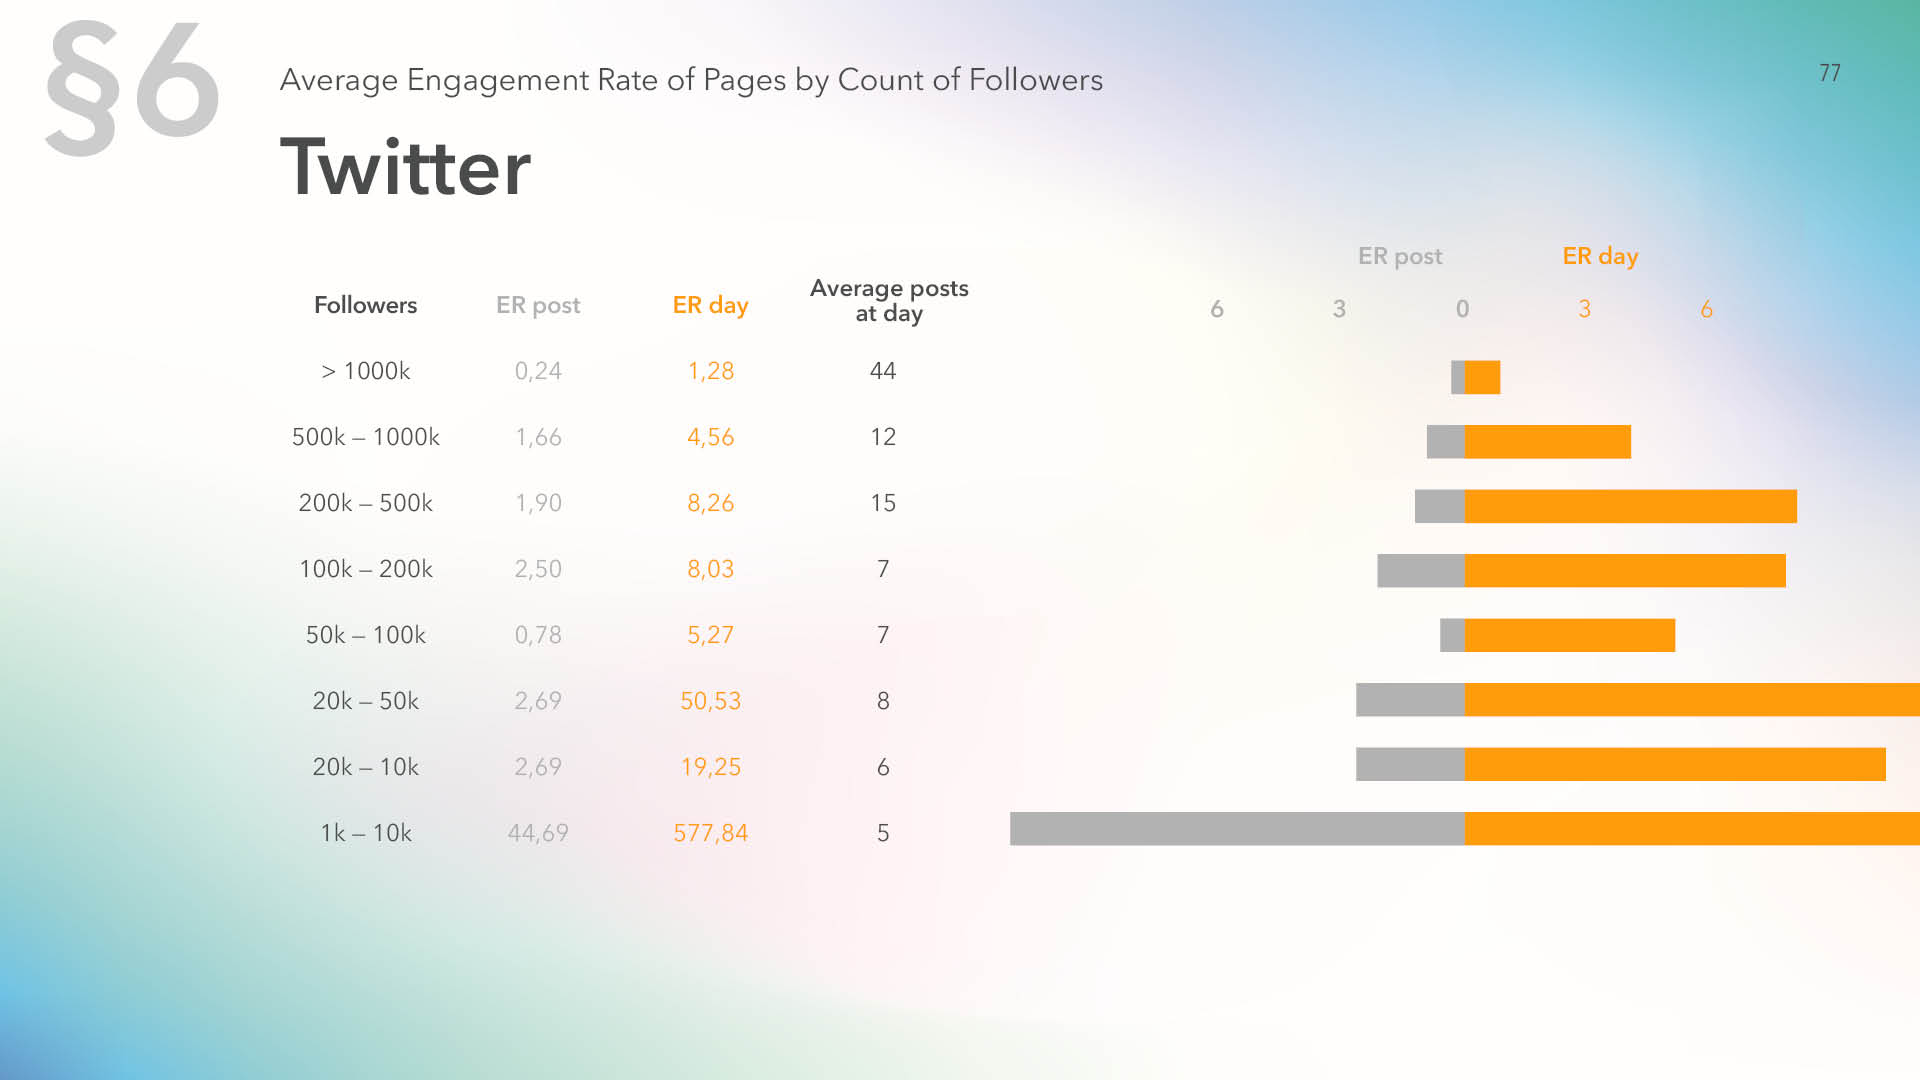
For this part of the study, we divided pages into 8 categories by audience size and calculated the average posting frequency and engagement rate.
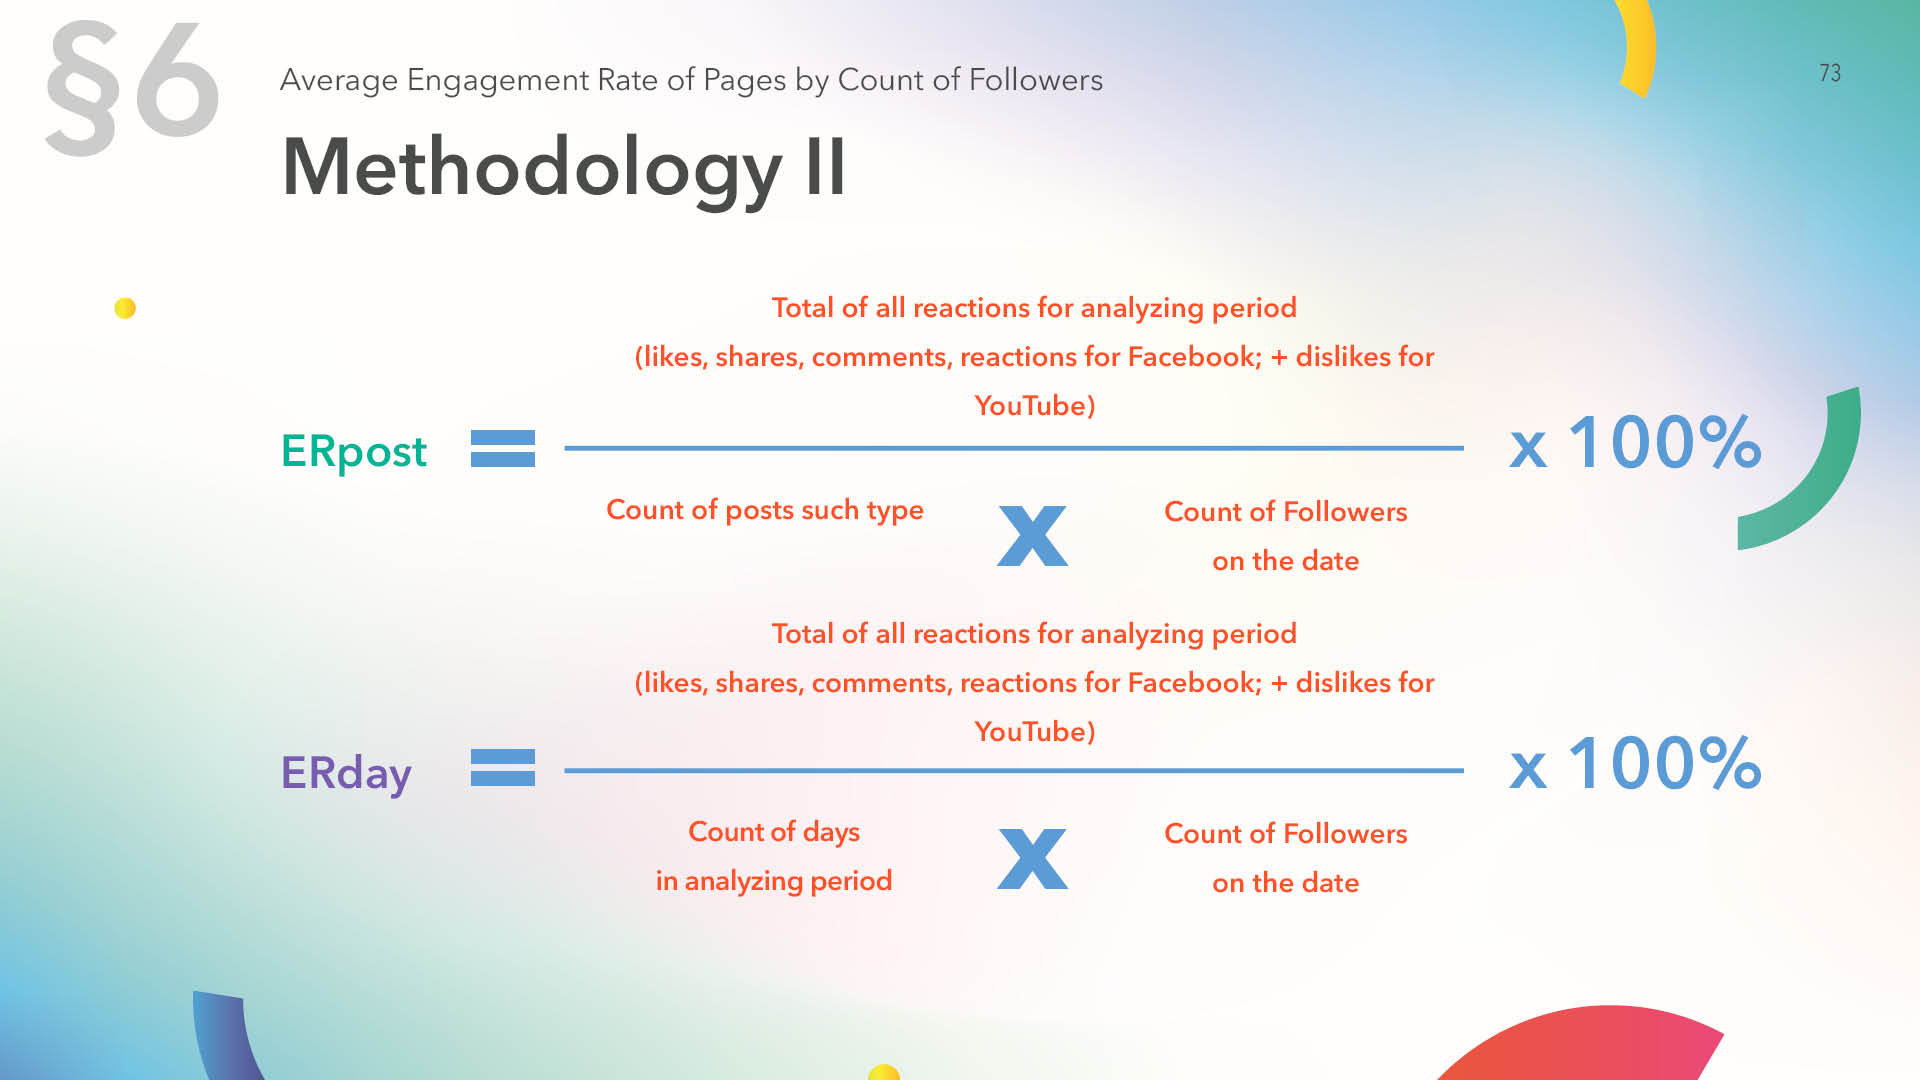
The study uses two engagement evaluation indicators:
ERpost = sum of reactions / number of posts * followers count * 100%
ERday = sum of reactions / number of days * followers count * 100%
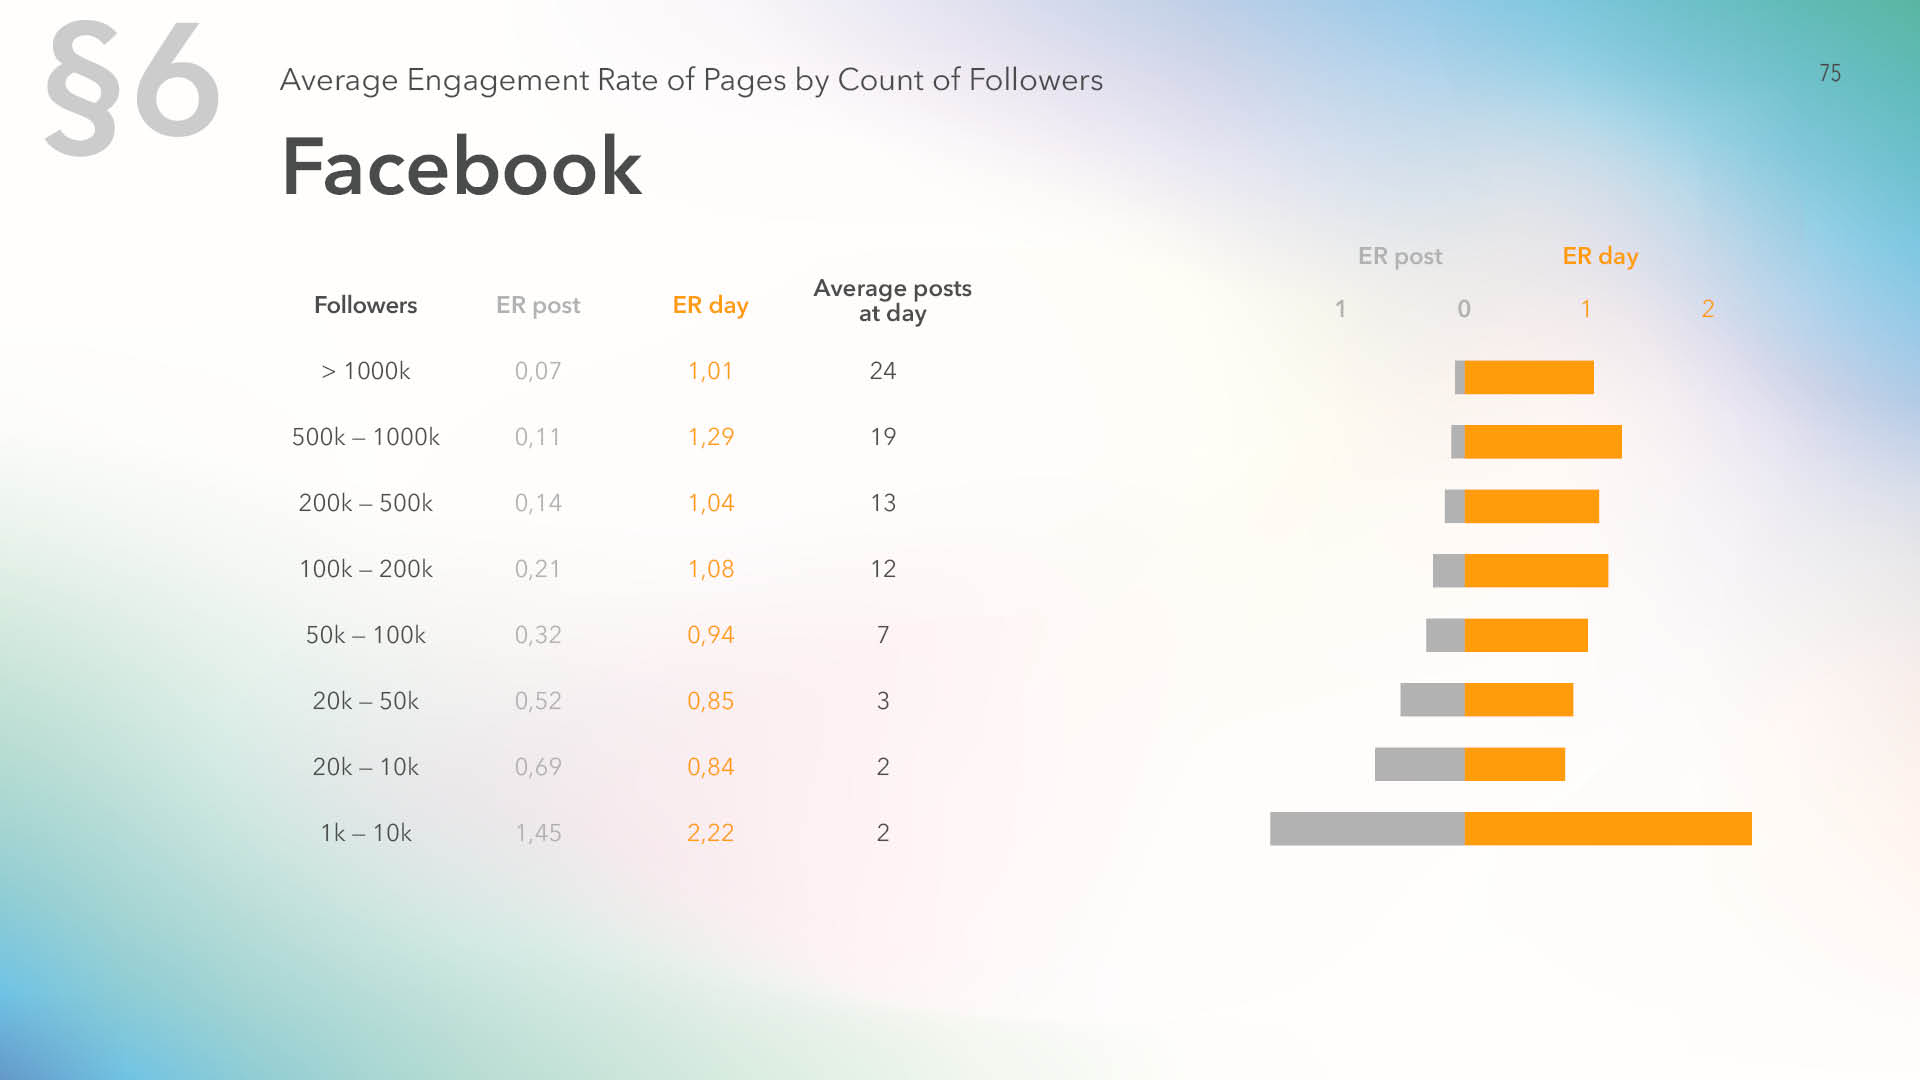
Facebook has small pages (up to 10 thousand subscribers) leading in both ERpost and ERday. 2018 saw medium ERday, comparable with medium communities’ results.
Small Instagram accounts receive highest engagement per post, as well as daily average. At the same time, posting frequency for large and small accounts varies narrowly: on the average, accounts with up to 100 thousand subscribers post once a day, and those with more than 100 thousand subscribers post twice a day.

As compared to the last year, Instagram shows sharp engagement growth: ERpost for small communities reached 5.32% (was 4.3%) and ERday is 11.17% against 3.09% in 2018.
One interesting observation is that ERpost is almost invariant for accounts of different sizes, indicating that algorithmic feed successfully distributes the audience’s attention among various pages.
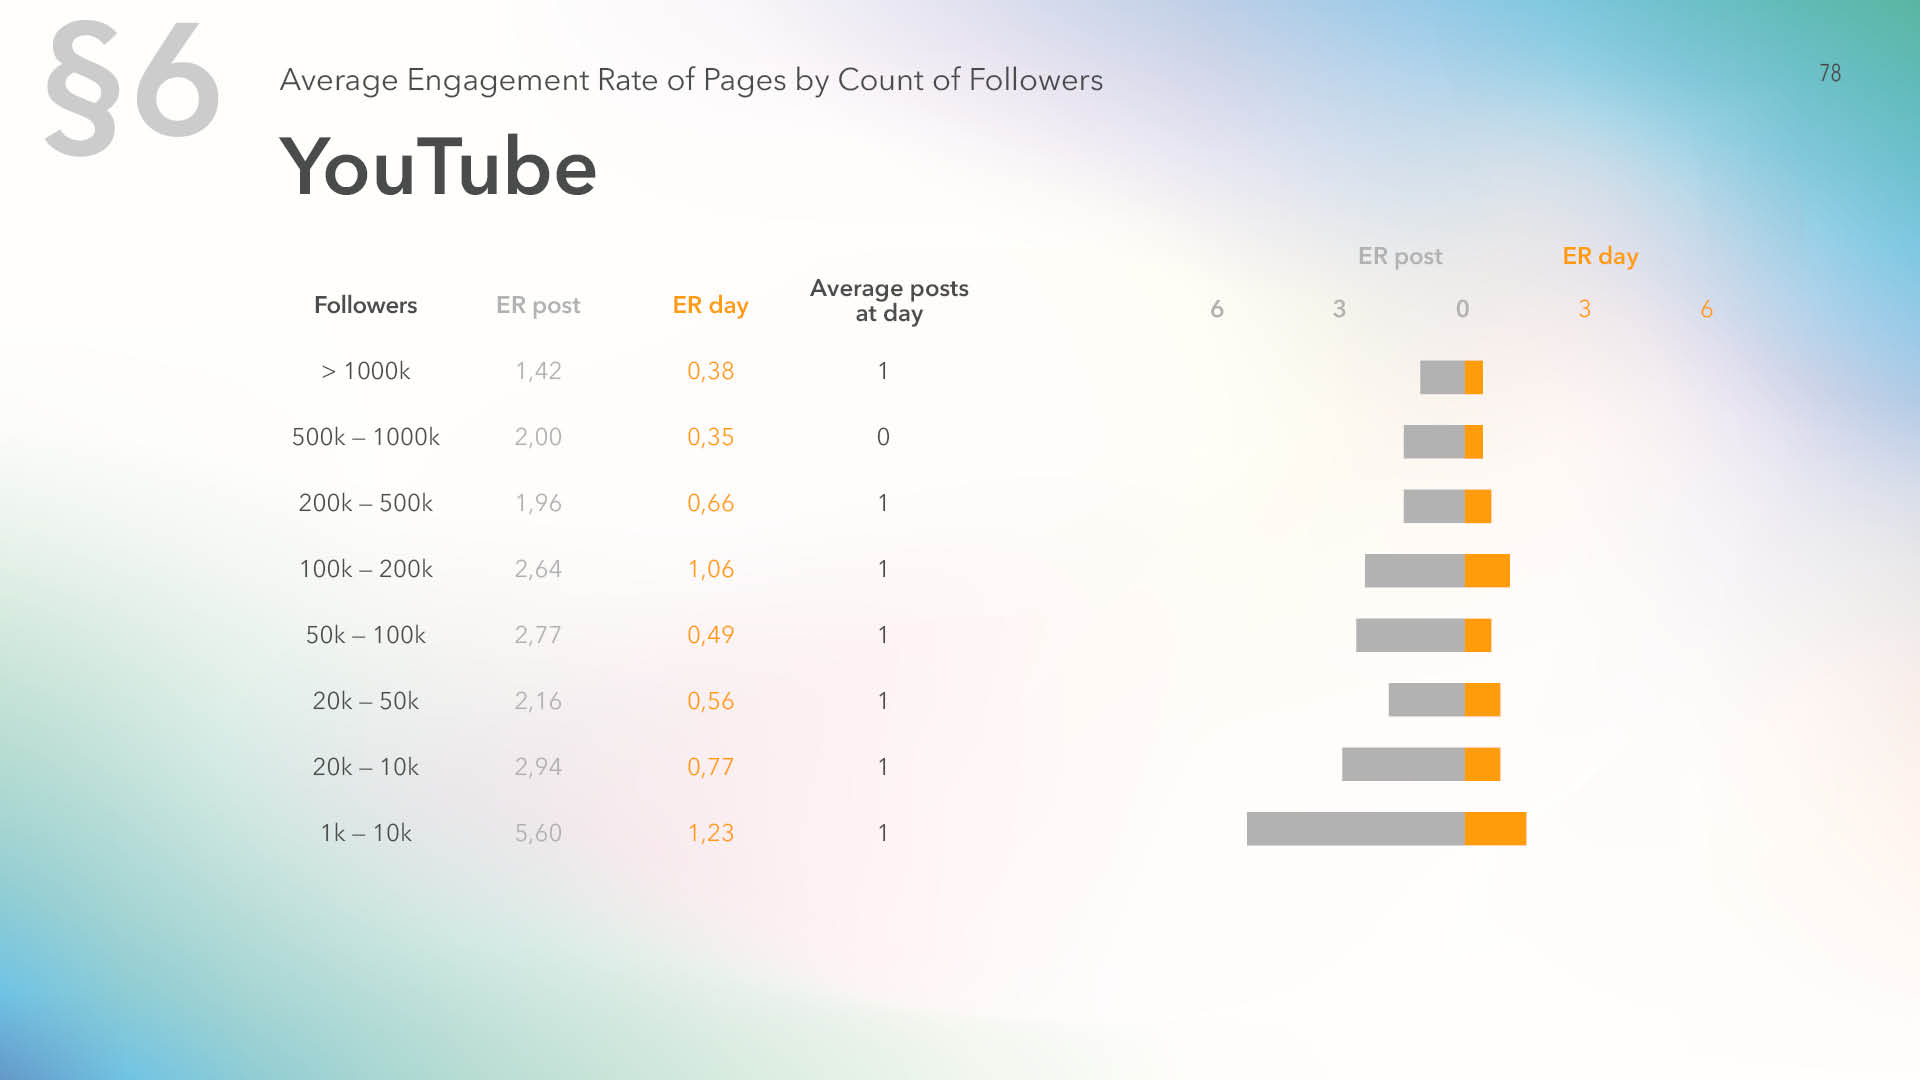
On YouTube, both small and large accounts post 1 video a day on the average. As different from other platforms, ERday here is lower than ERpost.
The highest engagement is enjoyed by accounts with up to 10 thousand subscribers.
As compared to 2018, Twitter saw increase in activity for large accounts. The engagement leadership is still with small accounts.
On TikTok, both large and small accounts post once or twice a day on the average, with the engagement higher for smaller accounts. Interestingly, TikTok shows almost direct proportionality between ERpost and ERday.
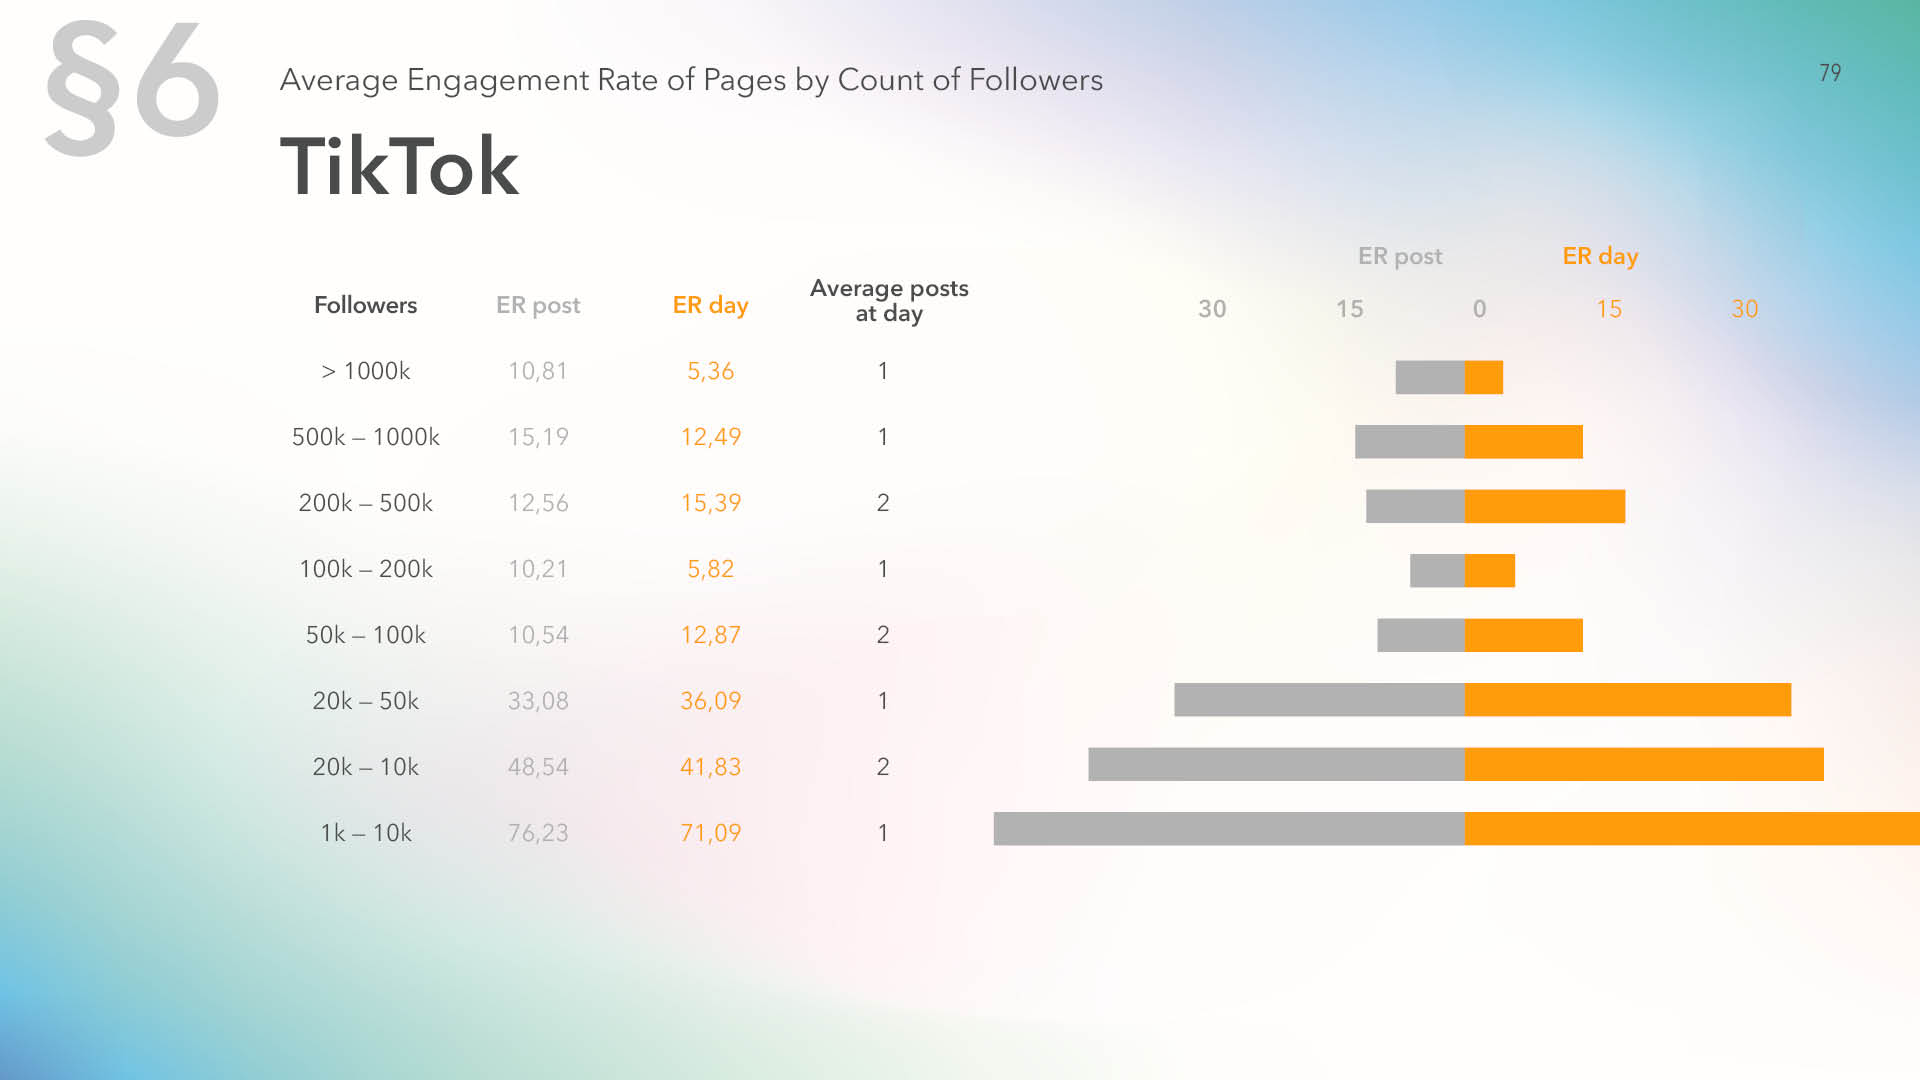
Furthermore, TikTok has demonstrated the highest engagement level: 10% to 30% for pages of any size.
Speaking about activity among other social networks, their average engagement level per post is seldom higher than 2%.
VK has positive correlation between community size and posting frequency. Communities having more than 100 thousand subscribers, publish 22 posts a day on the average.
Such communities have highest ERday but lowest ERpost.
The highest engagement per post is enjoyed by small communities, 10 thousand or less.
The picture for VK has not changed compared to 2018: large communities post more often, receiving highest ERday, but the engagement per post (ERpost) is lower than for small communities.
OK also has small communities leading in engagement, while placing least posts a day.
Conclusion
The sample for the total statistical calculation has remarkably increased this year, with the total number of analyzed posts breaking half a billion (just for public pages), and this time the data do not exclude different geographic areas, therefore the study will be relevant for any time zone.
The statistics was supplemented by Flickr, Tumblr and TikTok data. As photo and video technologies develop, new social media with graphical content become more topical, and professional communities (Flickr is a photo hosting network with a significant focus on photography professionals) continue growing their audiences.
The study results continue the last year’s trends – the average activity is higher on weekends than on weekdays, and night hours (9 p.m. to 1 a.m.) often turn out to be at least as active as daylight hours.
One thing that is worth noting is the extremely high engagement level for TikTok posts (5 to 10 times higher than for other social networks), which may be an important criterion for choosing a platform for marketing activities.
The study doesn't focus on only brand pages, so the results can be a benchmark for comparing any pages.
Study by: Arthur Kalin, Arseniy Kushnir
Text by: Marina Kolmykova, Arseniy Kushnir
Useful articles on a similar topic:
Try Popsters Trial plan to get content activity statistics of any pages for a next 7 days for free
Try for free
Popular
-
 YouTube Analytics and Statistics for Other Channels
-
 How to Increase Telegram Subscribers: Best Free Ways
-
 How to Remove fake Followers on Instagram and Is It Necessary?
-
 Analytics and Statistics for Any Telegram Channel or Chat
-
 Instagram Statistics and Analysis: How to View Data of any Account
Try Popsters Trial plan to get content activity statistics of any pages for a next 7 days for free
Try Popsters