Russian Speakers’ Activity on Social Media in 2018: Popsters’ Study
Audience activity on different social media may vary depending on popular content format, algorithmic feed, hour of the day, day of the week and multiple other factors.
Based on community analyses done by Popsters users in 2018, we aggregated data on 580 thousand various public pages on 7 social media, considering summarized characteristics of 460 million posts.
We share the study’s results, discussing the hours of the day and the days of the week performing best for posting, ER ratio and post count with subscriber count, interest in posts with different text lengths on different platforms and many more.
For the detailed methodology and full version of the study, read:
Social Media Users Activity Global Research 2020
A study of audience activity in Social networks in 2019.
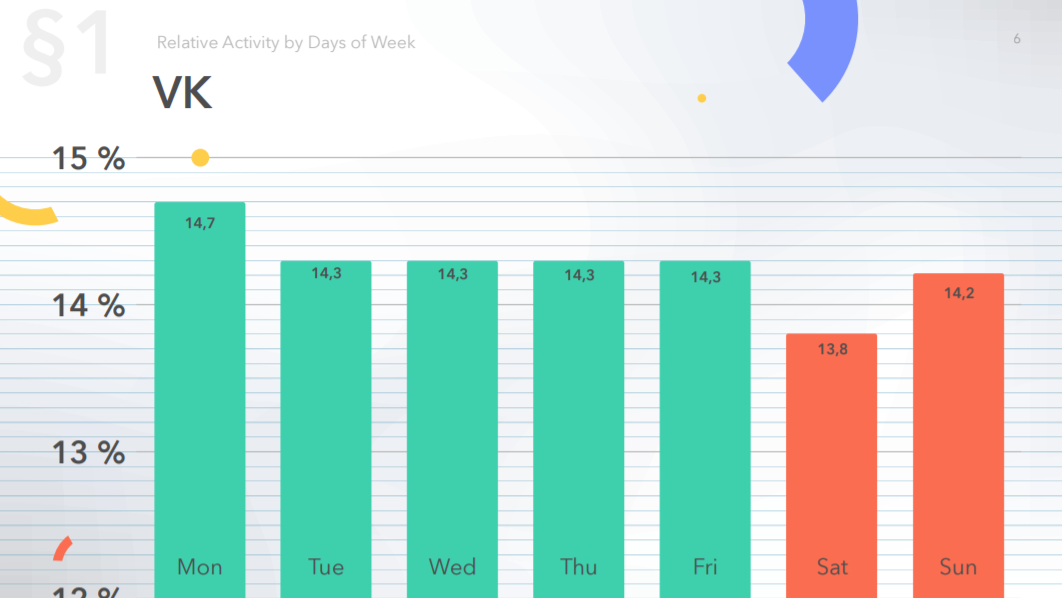
The dependence of activity on Social Media from the Day of the Week
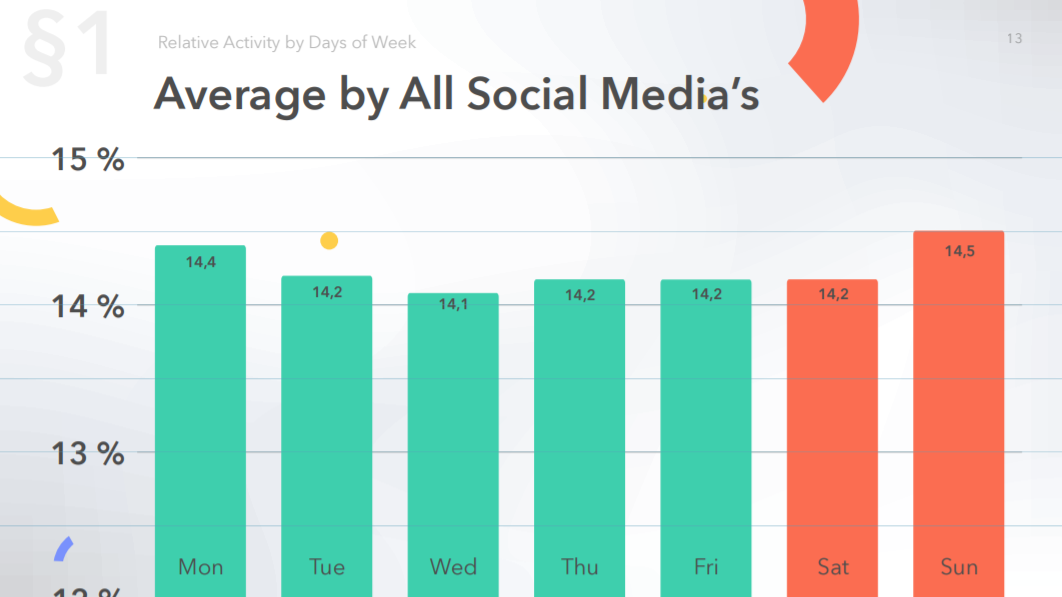
Sunday and Monday turned out to be the most popular days on the average on all social media. Last year, users generated most of the activities on Tuesday.
The study results show that the Social Media activity remains almost constant during a week, with a little decrease noticeable on Wednesday.
The day with the highest activity on VK is Monday. Decrease is noticeable on weekends, especially Saturday.
Facebook posts, on the average, gained the highest engagement on Monday. There is a decrease on Saturday; Sunday, however, doesn’t differ from weekdays.

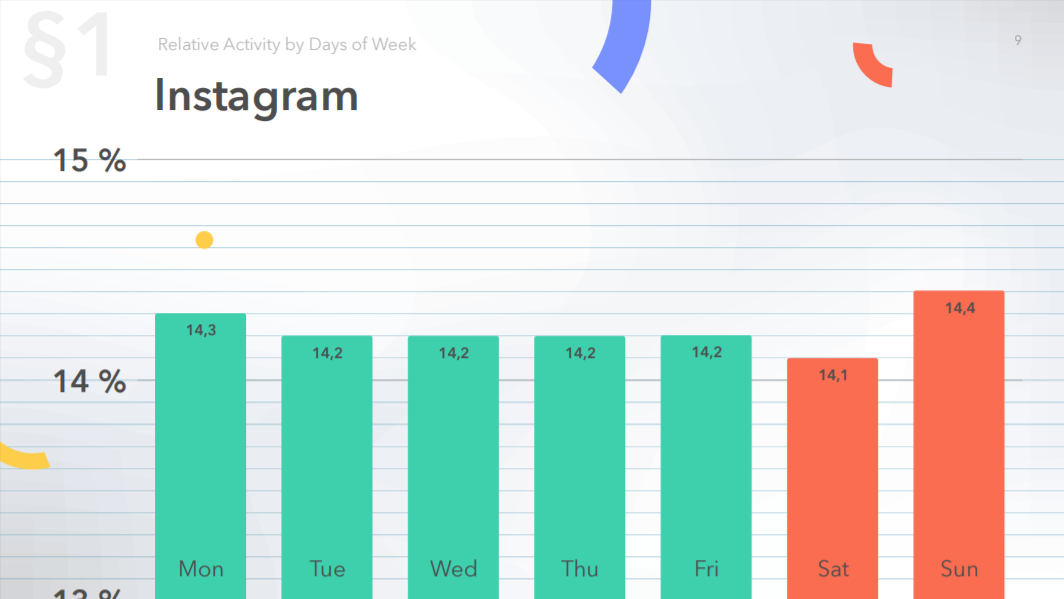
Instagram posts received the lowest engagement on weekends.
Posts on OK.ru received the highest engagement on Monday and the lowest engagement on Tuesday.
Twits, on the average, received the highest engagement on Monday, with a decrease on Thursday and Friday.
Telegram posts gained the highest engagement on Saturday.
YouTube videos uploaded on Tuesday and Sunday saw the highest engagement, with Wednesday turning out to be the quietest day.
For all social media on the whole, the highest engagement was received by posts on Sundays and Mondays, with Wednesday being the worst day in terms of engagement.
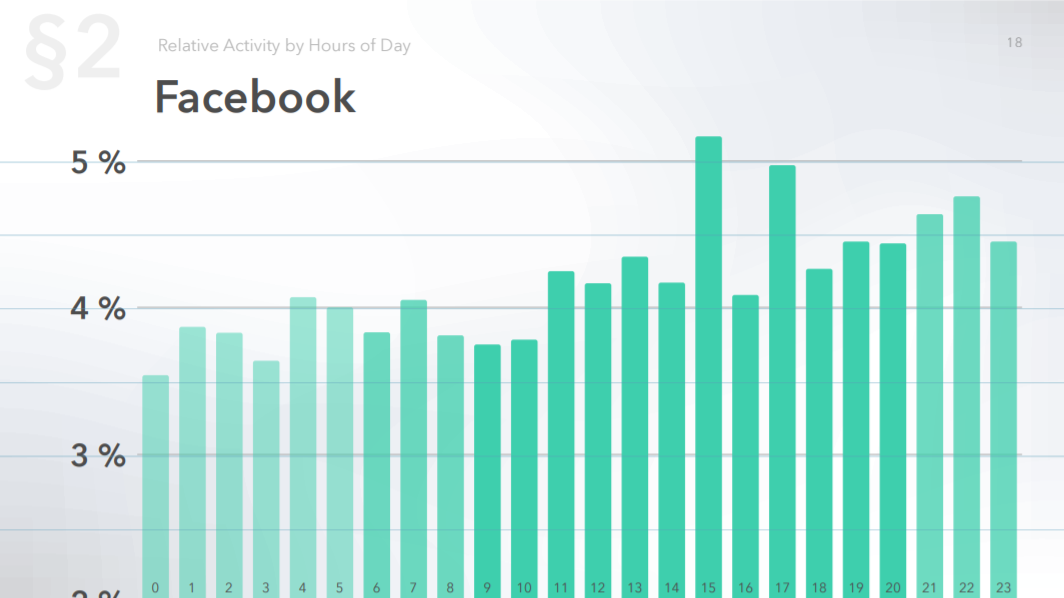
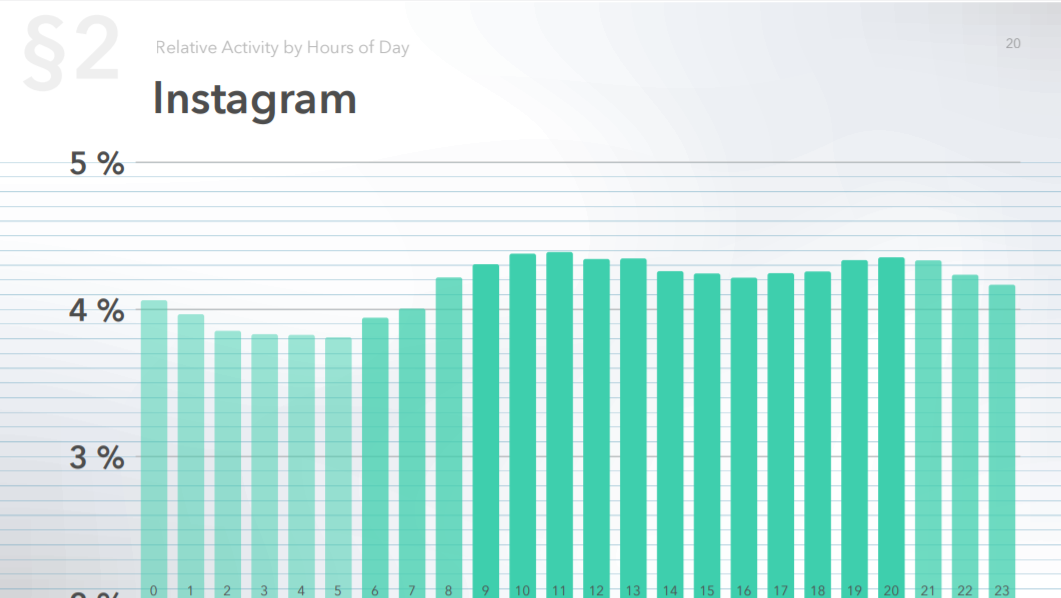
Audience Activity by Hour of the Day
Posts on VK published between 9 p.m. and 1 a.m. receive the highest engagement. Posts published between 3 and 5 a.m. perform worst.

The situation on Facebook is different: the highest performance is shown by posts published between 3 and 5 p.m., with midnight being the worst time to post.
Instagram posts published between midnight and 7 a.m. receive least likes and comments. Two activity peaks on social network are noticeable: 10 to 11 a.m. and 8 to 9 p.m.
Activity by OK.ru users decreases from 11 p.m. to 7 a.m.
Twits receive the lowest engagement between 4 and 7 a.m. and the best time to post is 10 a.m.
The average engagement for YouTube videos drops at 10 to 11 p.m.; it increases again, however, at 1 a.m. and decreases by 3 a.m. Morning and midday, between 9 a.m. and 2 p.m., is the most active period (as well as 1 a.m.).
On Telegram, the highest engagement is received by posts published at 3 and 10 a.m.
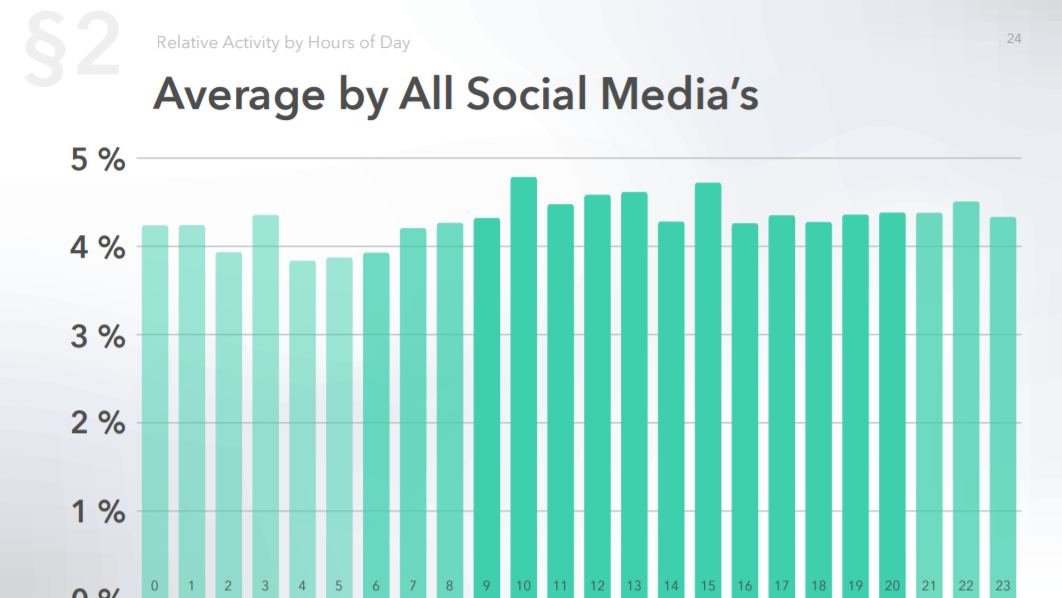
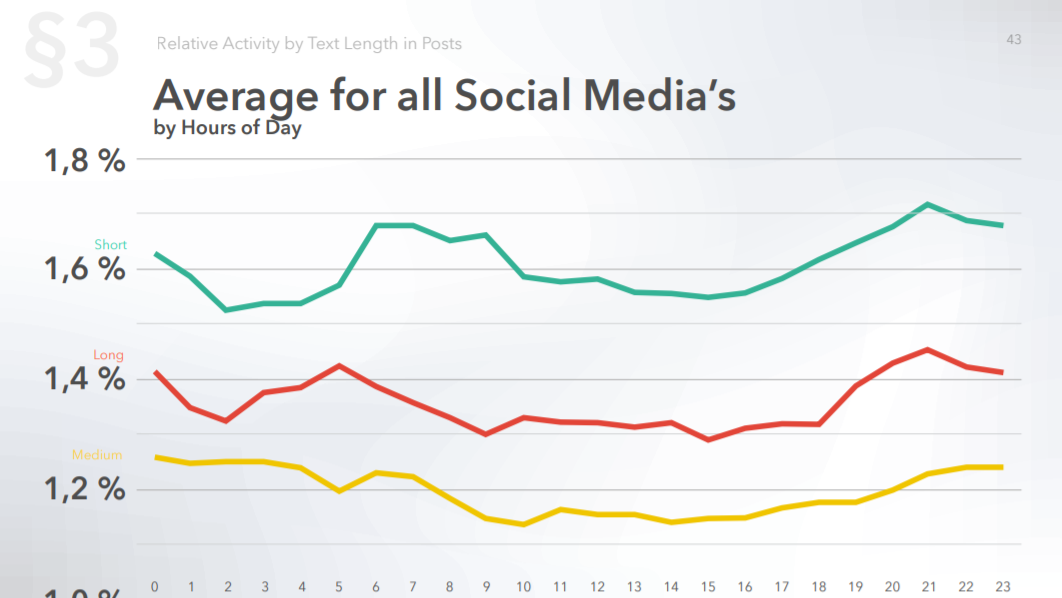
The diagram below shows average activity distribution by hour for all social media.
The Type of Content and its impact on Engagement
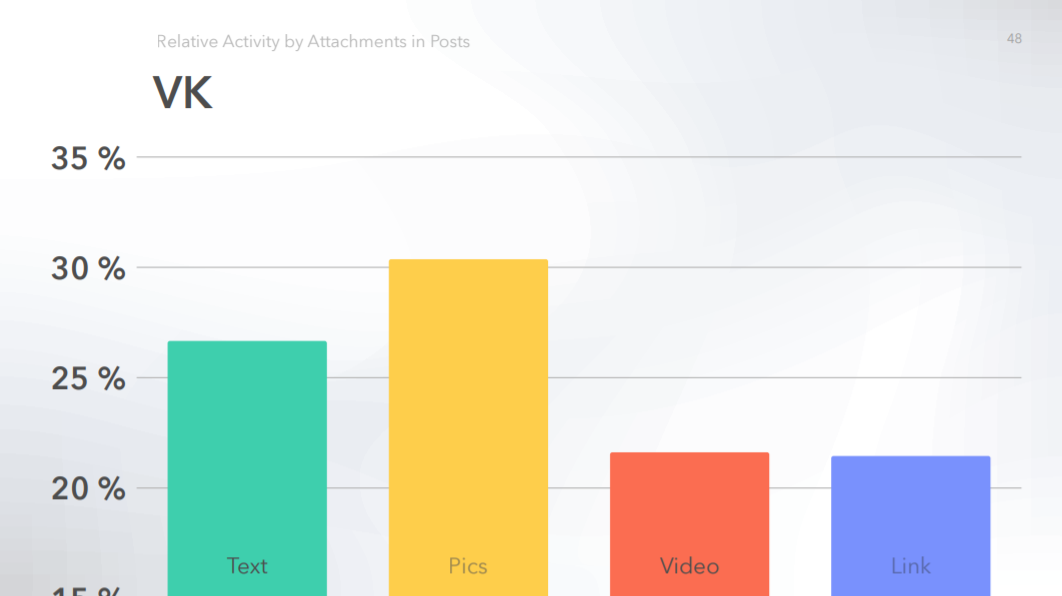
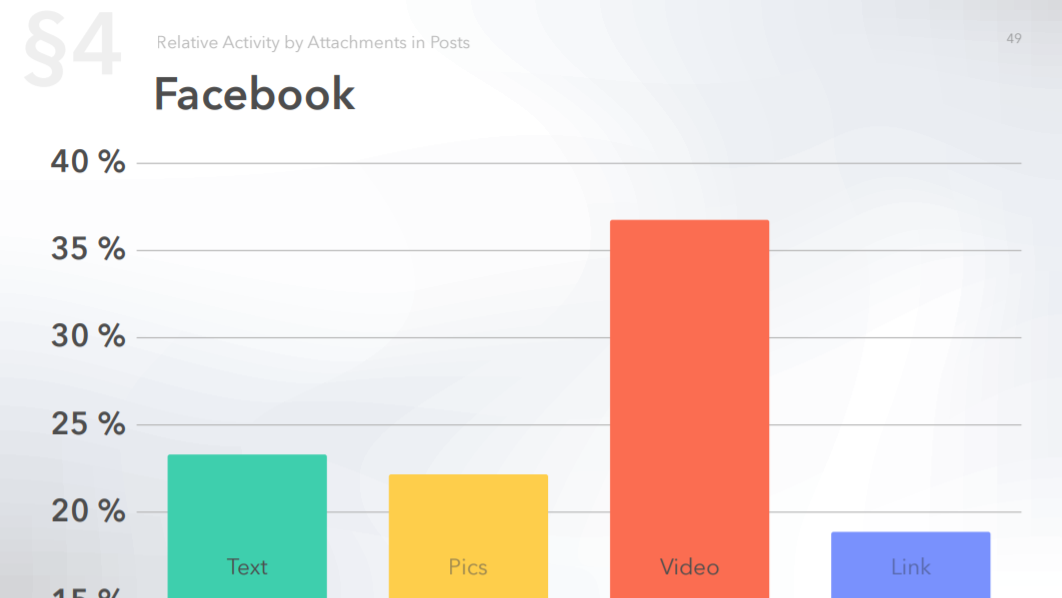
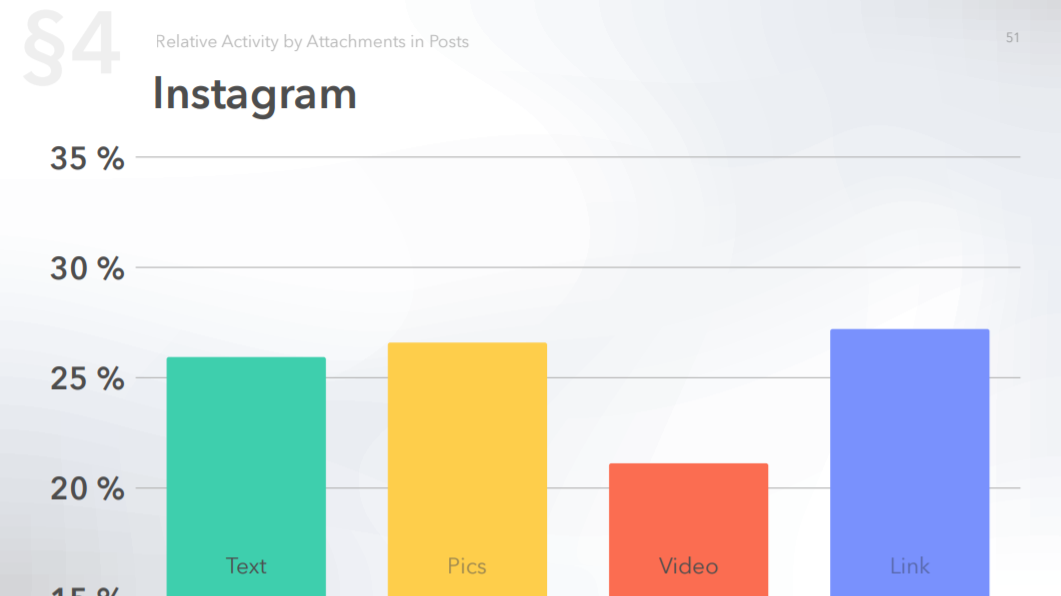
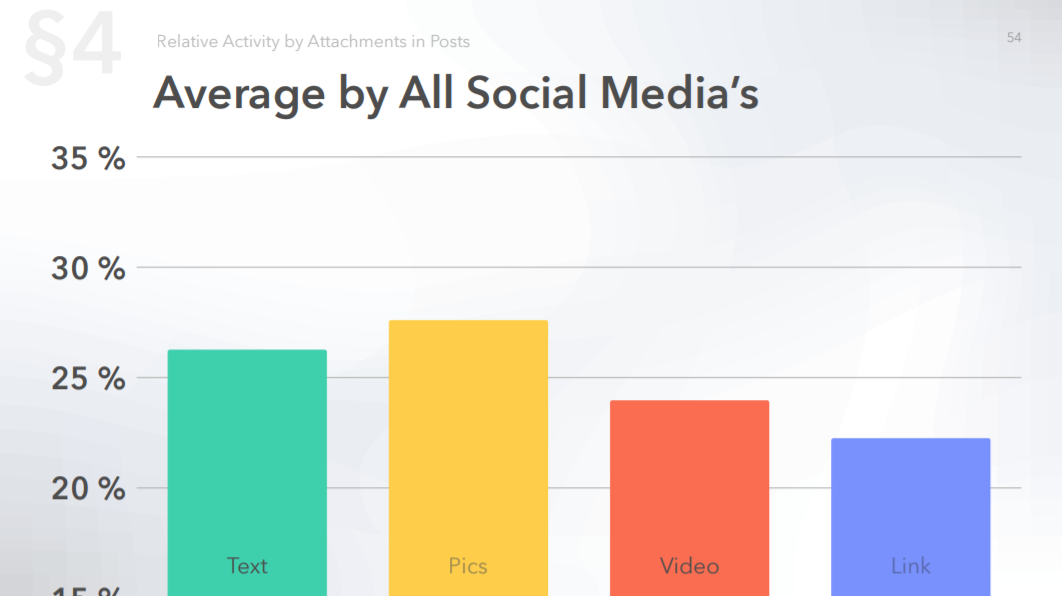
Popsters divides all posts into 4 formats: texts, images, videos, links. Now you will learn, how the type of content affects activity and involvement of subscribers on Social Media.
Posts on VK with images turned out to have the highest performance and posts with videos or links are outperformed by posts with images or text.
Posts on Facebook with videos perform significantly better and posts with links show the lowest performance.
On Instagram, the content type influenced the engagement insignificantly.
For Instargam, a link is considered to be other account’s tag using @ in the description or links to external resources included in the description (despite the fact they are inactive).
On OK.ru, the highest engagement was received by posts with text and users engaged least with posts containing a link. Posts with videos received less engagement than those with images.
The video format is significantly down on Twitter, with engagement distributed almost evenly among the other content types.
Telegram has a unique situation with images, being the only platform where this format performs worst. Probably, this has to do with the restriction on the image description length: most of the information is published separately from the image and the latter doesn’t receive forwards.
For all social media on the whole, images lead, with text being the second. Videos receive less engagement than images, and links, as expected, are the least performing content type.
By paying close attention to Social Media content analytics, you can easily measure and improve your efficiency against your Social Media goals.
Text Length
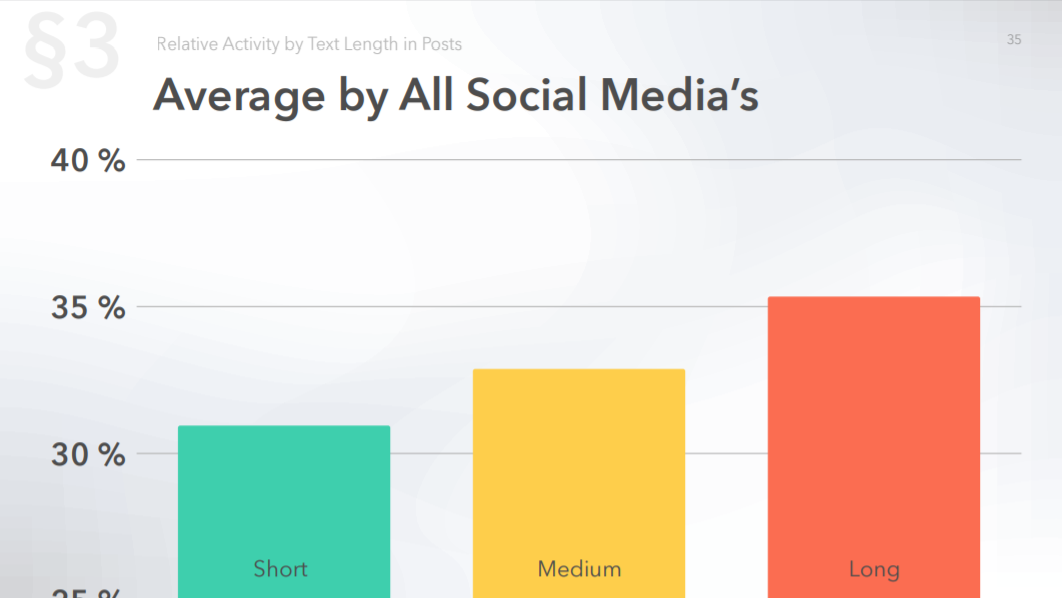
Engagement diagrams for posts with different text lengths illustrate the principle ‘the more the better’. On most of the platforms, the highest engagement was received by posts with lengthy texts.
Short post: up to 160 characters
Medium post: 160 to 1000 characters
Long post: longer than 1000 characters
On VK, maximum engagement was received by posts with short texts.
- A handy Vk analytics tool for analyzing your own and competitor pages.
On Facebook, medium-length posts perform best and long posts turned out to have the poorest performance.
Instagram statistics confirmed that long descriptions are trending: such posts received the highest engagement.
The situation on OK.ru is opposite: short texts perform better than long and medium ones.
The audiences of Telegram and YouTube engaged better with long texts and short texts received the least engagement.
Text Length / Day of the Week
For VK, short texts consistently lead for the entire week — even on Sunday when the interest in long-reads increases on other platforms.
For Facebook, long texts receive more engagement early in the week, starting on Sunday, but short texts outperform other text lengths on weekends.
For Instagram, the engagement distribution by text length remains constant throughout the week.
For OK.ru, weekends see rising interest towards long texts, and long-reads perform best on Mondays.
For Telegram, Thursday is for medium-length texts. Long posts lead on the other days. Users engage with them best on Sundays.
For all social media on the whole, the interest in a particular text length is influenced by the day of the week insignificantly. An increase in the interest in lengthy materials is noticeable on Mondays, Wednesdays and weekends and in short texts — on Sundays.

Text Length / Hour of the Day
The interest towards short texts remains almost unchanged during the day. A small increase is noticeable between 5 and 9 a.m. and between 7 p.m. and midnight.
Long texts lose popularity in the midday, with the periods performing best for them being 7 to 9 p.m.
General
VK: almost direct correlation between subscriber count and post count: major pages, with more than 100,000 subscribers, publish more than 10 posts a day.
The situation with ER (ERpost in the diagram) is opposite: in small communities, every post receives better engagement. Total ER for all the posts of the day, however, increases in proportion to the subscriber count and post count.

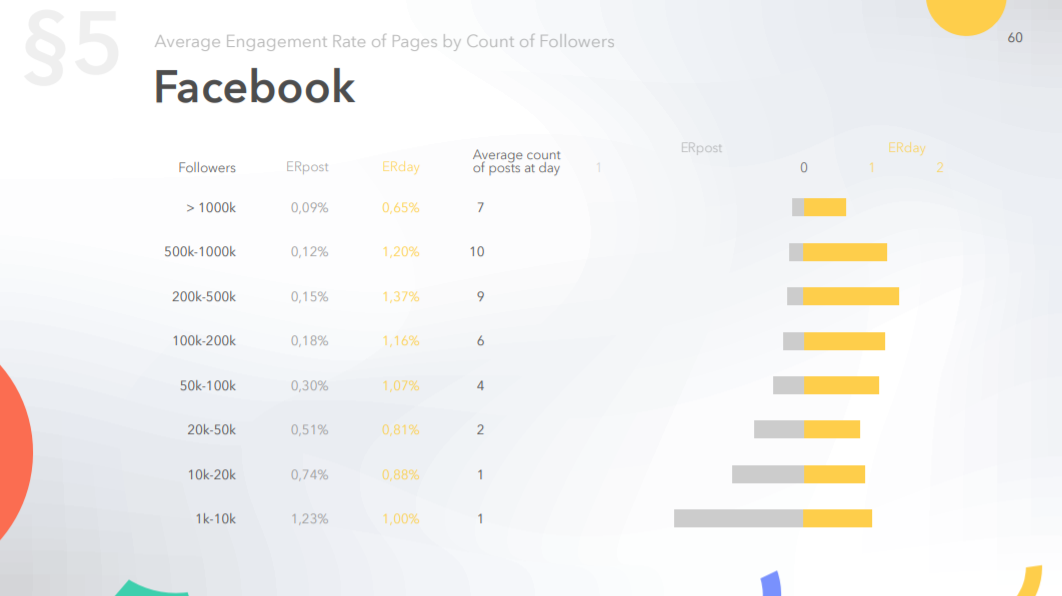
Major Facebook pages typically make more posts a day but have lower ERpost for each such post.
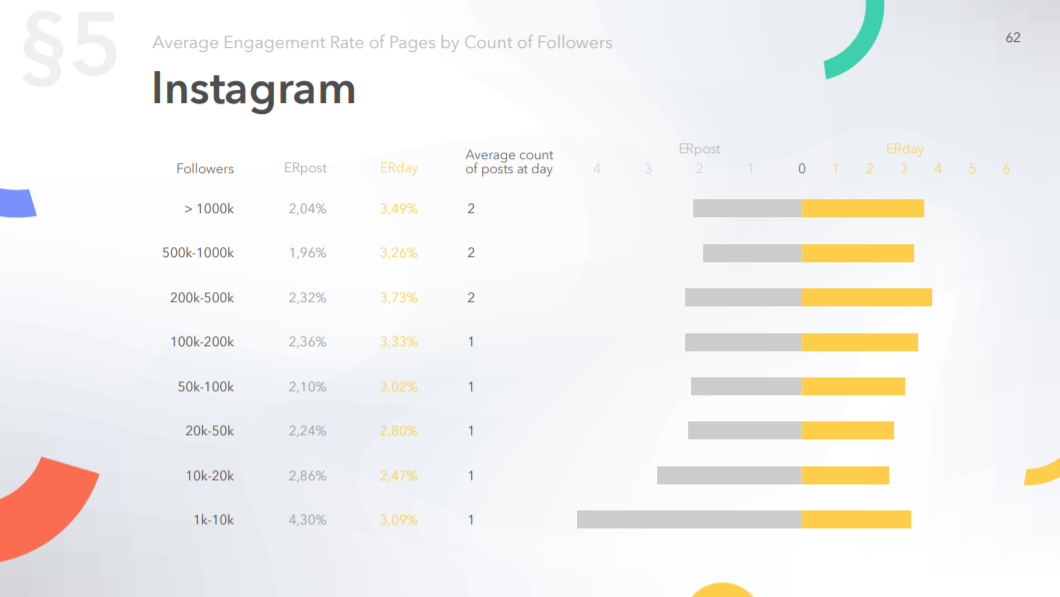
On Instagram, small accounts below 10 thousand subscribers receive better engagement per post: their average ERpost is 4.3%.
However, no significant ERpost drop is observed with increase in subscriber count from 50 thousand to million+ accounts: the indicator remains at 1.96% to 2.36%.
For OK.ru, just like VK, major groups publish more posts, each receiving less engagement.

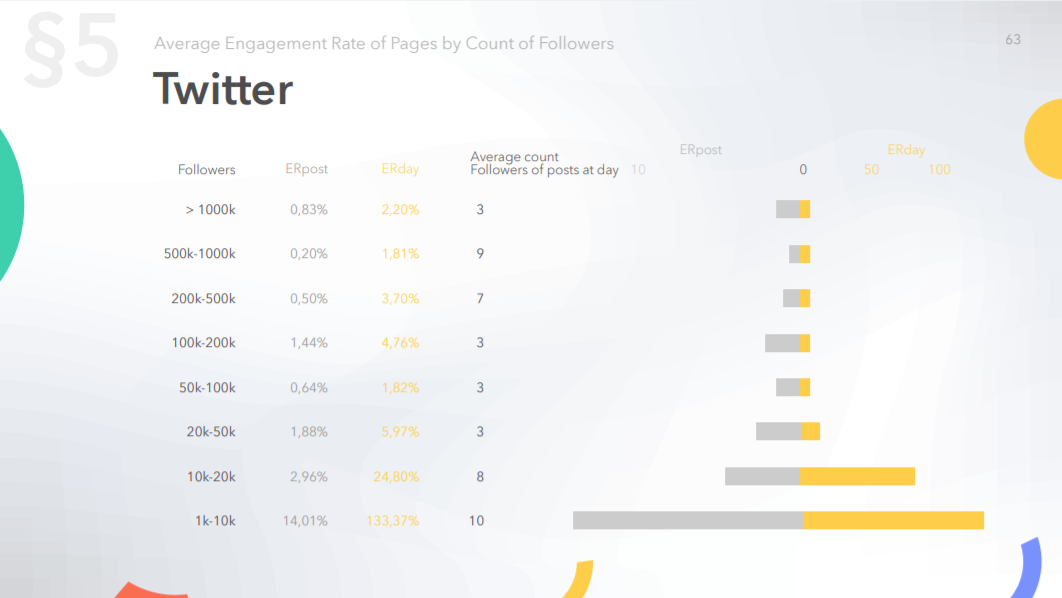
The best engagement per post was shown by small Twitter accounts (up to 10,000 subscribers) and large accounts have the worst ERpost. It’s worth noting that, in contrast to other platforms, ERday here doesn’t increase in proportion to the subscriber count and post count — every twit gains engagement on its own, independently of other content of the account. This is attributable to the Twitter’s new feed algorithms.
On YouTube, small accounts receive the best engagement both per post and on daily average. The reason is probably that creating video content takes more labor and even major channels do not publish several posts a day.

Now you know which factors affects subscriber engagement the most and how to significantly increase activity on social media.
Useful articles on a similar topic:
- Qualitative Social Media Competitive Analysis in 10 minutes;
- How to calculate Engagement Rate for Social Media Platforms;
- The best free ways to analyze the statistics of any Telegram page;
- Most important YouTube metrics and KPIs to track.
Try Popsters Trial plan to get content activity statistics of any pages for a next 7 days for free
Try for free
Popular
-
 YouTube Analytics and Statistics for Other Channels
-
 Instagram Statistics and Analysis: How to View Data of any Account
-
 How to Increase Telegram Subscribers: Best Free Ways
-
 How to Remove fake Followers on Instagram and Is It Necessary?
-
 Analytics and Statistics for Any Telegram Channel or Chat
Try Popsters Trial plan to get content activity statistics of any pages for a next 7 days for free
Try Popsters