Social Media Analytics Report: Fast and Easy Creation

The end of month may become a nightmare for an SM marketer, because they need to prepare a detailed and neat report on the work done. This job can be simplified and optimized to spend less time and have no worries.
What to Include in a Social Media Analytics Report
Solid social media report should clearly show what’s working, what’s not, and how this impacts business goals. It shouldn’t be just a dump of numbers — it’s a structured snapshot of performance, insights, and next steps. A good report typically includes:
- Objectives & period — what goals were set (awareness, engagement, leads, sales) and the reporting timeframe.
- Audience growth — follower dynamics, reach, impressions, and audience quality trends.
- Engagement metrics — likes, comments, shares, saves, ER, and how users interact with content.
- Top-performing content — posts, formats, and topics that delivered the best results with brief explanations why.
- Traffic & conversions — clicks, website visits, leads, or sales driven from social media (if tracked).
- Paid vs organic results — clear separation and comparison of ad performance and organic content.
- Insights & conclusions — key patterns, anomalies, and lessons learned.
- Actionable recommendations — specific steps to optimize content, posting strategy, or budget next period.
This structure helps stakeholders quickly understand performance and make data-driven decisions, not just review metrics.
Social Media Report Contents and Structure
The report is needed not to scary the client or manager by tables with unclear figures, but to summarize the work and illustrate the results for an outsider.
A good SMM report is to be easily readable even by a person who doesn’t know the project’s essence and is new to the subject.
Before gathering data, decide what information you want to reflect in the Social Media report and what to emphasize.
Key social media reporting metrics to include
Choosing the right reporting metrics is essential to evaluate performance objectively and tie social media activity to real outcomes. Key social media reporting metrics should focus on visibility, engagement quality, and business impact, rather than vanity numbers alone. The most important metrics to include are:
- Reach & impressions — how many unique users saw the content and how often it was displayed.
- Follower growth rate — net audience growth over time, not just total followers.
- Engagement rate (ER) — the quality of interaction relative to reach or followers.
- Likes, comments, shares, saves — core engagement actions showing content relevance.
- Click-through rate (CTR) — how effectively content drives users to external links.
- Website traffic from social — sessions, pages per visit, and bounce rate from social channels.
- Conversions — leads, sign-ups, purchases, or other tracked actions driven by social media.
- Cost metrics (for paid campaigns) — CPC, CPM, CPA, and ROAS to assess efficiency.
- Content performance by format — comparison of posts, stories, reels, videos, or carousels.
- Posting consistency & frequency — how regularly content is published and its impact on results.
Tracking these metrics consistently allows SMM specialists to identify growth opportunities, optimize strategy, and clearly demonstrate the value of social media efforts.
How to Analyze Community Promotion
Results of targeted advertising and seeding will be likely to be of prime interest to the client, as they need to know how effective the ad costs are.
The promotion results for most of ad campaigns can be seen in two places:
- Social media’s ad dashboard.
- Analytical tools, Google Analytics or Yandex Metrica.
To compare the data, you’ll have to work in Excel, unless you pre-set collection of statistics from systems inside the analytical system.
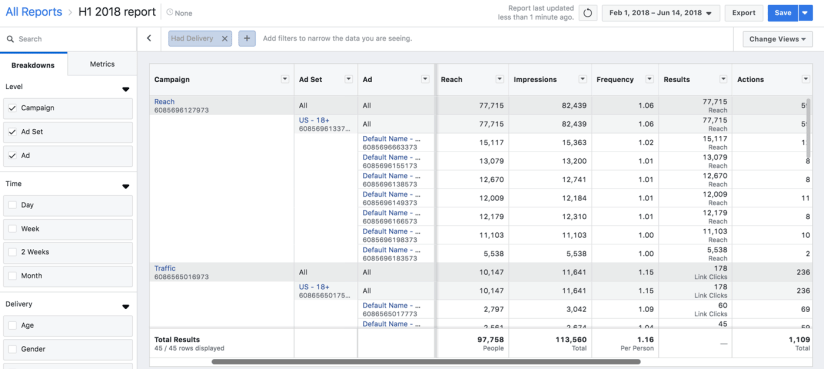
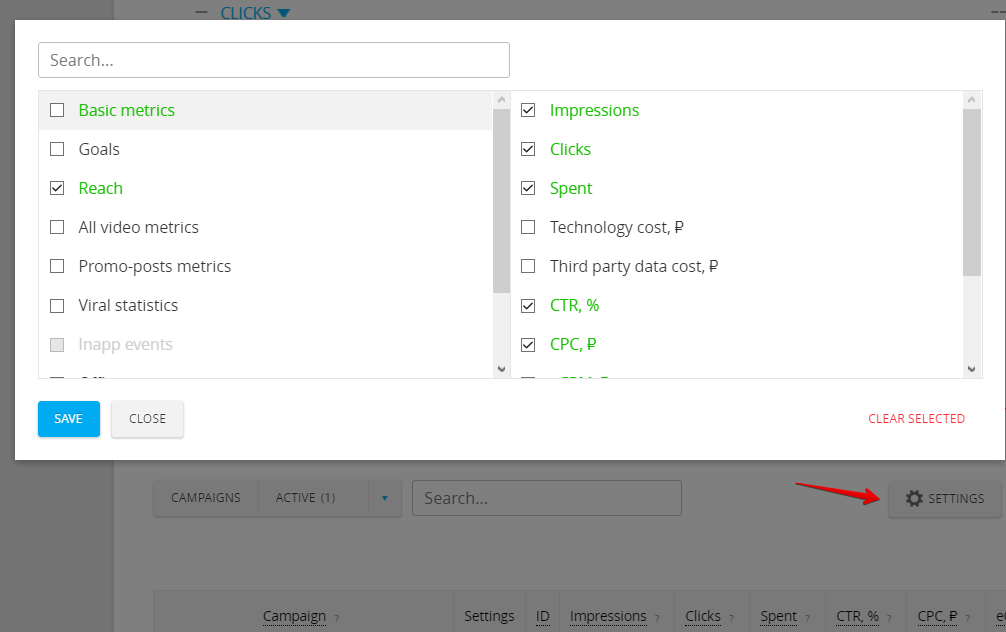
Facebook allows setting up automatic report generation and exporting data when necessary or analyzing them online.
Here you can set the appearance of your Social Media report: select metrics (all the ad data to be collected by Facebook) and breakdown. The report can be saved or exported.
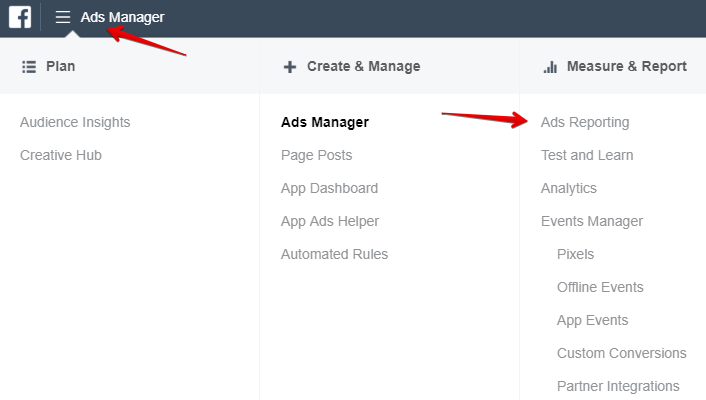
Facebook and Instagram
Using Facebook’s Ads Manager, you can set up a report and regularly export it, updating only dates.
To do that, open Reporting section, set the required columns, select the companies and save the report.
To download the Social Media report, click Export.
VK
VK’s targeted ad statistics is collected in Export Statistics section of the ad dashboard:
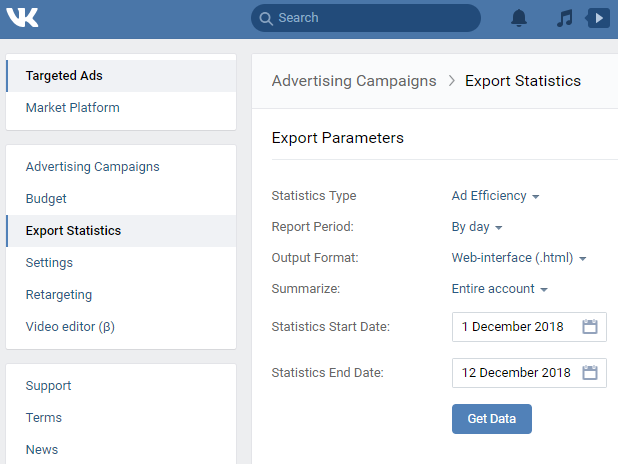
The Ads field is to set the type of statistics to export:
1. All ads.
Export information on the budget spent, view count, click count, CTR.
2. Posts in communities.
Effectiveness of posts: total reach, subscriber reach, budget spent, group view and join counts, click-through count, complaints, hides, entire group hides.
Choose the parameters you need:
- Ad dashboard for the client of interest.
- Reporting period and dates.
- Format (view in browser or download Excel spreadsheet).
MyTarget
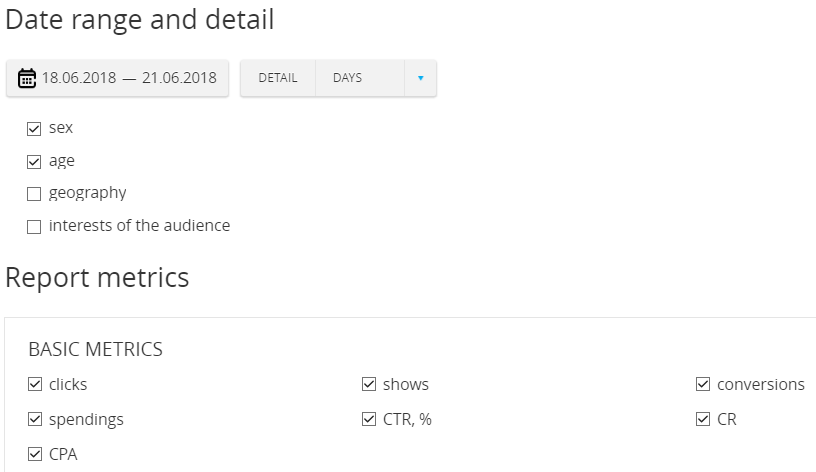
Two types of statistics are available: normal statistics and Report Builder.
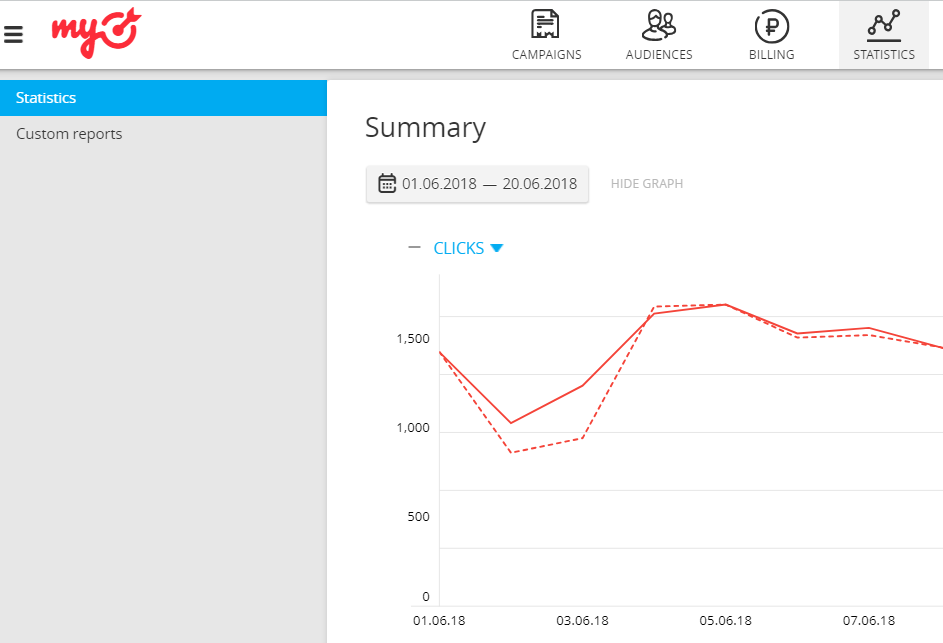
Ad effectiveness can be analyzed in a normal report. Select the metrics you need from Column Settings section. The result is exported to Excel.
Report Wizard shows demographic data of the audience who engaged with the ads.
Content Analysis
Evaluating the content is more difficult, since performance indicators are not obvious. SMM report measures:
- Subscriber count.
- Post reach.
- View count for a particular post.
- ER (engagement rate).
In addition, post count or contest participation may be a separate KPI.
Social Media’s Internal Statistics
Part of this information can be found in social media’s internal statistics. For example, detailed statistics for a Fb group provides information for every post:

Using the Facebook Analytics tool, you can also analyze the audience’s interests and demography.
One drawback of systems’ internal statistics is that it takes time to compile all the exported data in a legible report.
Social Media Content Analysis Using Popsters
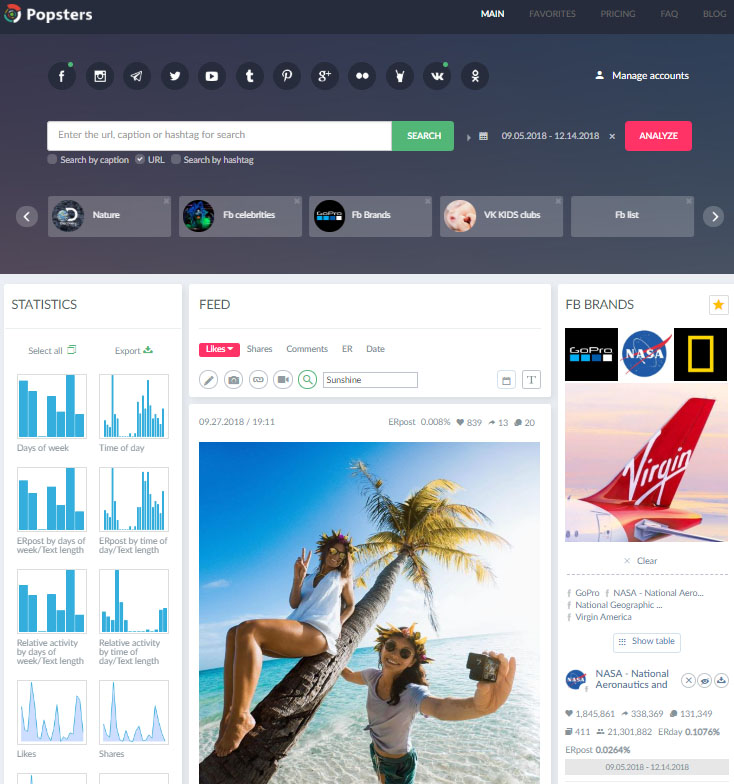
If you don’t have time for that work, Popsters analytical tool will help you out. You can use the tool to generate an Social Media report in five minutes:
- Paste the community URL to the search box and specify the reporting period in dates.
- To the right below the group’s avatar, you’ll see Table pushbutton. It summarizes statistics over the period for the number of posts, likes, shares, comments, as well as calculated ER.
- The left column of content analytics tool shows diagrams with Social Media account statistics.
- To export all the published posts, click X. You will get a document with the texts and links to media files of all the released posts.
Useful articles on a similar topic:
- How to Calculate Engagement Rate for Social Media Properly;
- What to Know About TikTok: Ads, Bloggers, Audience and Promotion;
- Ways to get advanced Telegram analytics data;
- An easy way of analysis for any YouTube channels.
Try Popsters Trial plan to get content activity statistics of any pages for a next 7 days for free
Try for free
Popular
-
 How to Remove fake Followers on Instagram and Is It Necessary?
-
 How to Increase Telegram Subscribers: Best Free Ways
-
 Instagram Statistics and Analysis: How to View Data of any Account
-
 Analytics and Statistics for Any Telegram Channel or Chat
-
 YouTube Analytics and Statistics for Other Channels
Try Popsters Trial plan to get content activity statistics of any pages for a next 7 days for free
Try Popsters