Social Media Audience Activity Global Research 2020
Social media advance more and more every year and start affecting more aspects of life. While initially users used to give preference to one or another platform, today’s social media often complement each other and are used in parallel to solve different tasks. Under such circumstances, it’s already not enough for businesses to duplicate their content in different channels but they need to customize, remake and sometimes present the content in a completely new form to account for the preferences of the platform’s audience.
Features of user behavior in every social network don’t stay the same: the users’ behavioral patterns, ways of communication, a preferred form of content, and access hours do change. The differences become especially noticeable in the context of increase in the competition between social media, as well as the unpredictable external factors of 2020, which affected the normal way of life of majority of the audience–new social communication rules and working conditions, restricted mobility, etc.
The Posters team has prepared the annual statistical study report of social media audience activity results in 2020.
The calculated data is based on more than 537 million posts on 1106 thousand pages of various brands, companies, entertainment communities, and bloggers on 10 social media: Instagram, Facebook, OK.ru, VK.com, Twitter, Telegram, Coub, Tumblr, YouTube, and TikTok. We took into account parameters of entries, such as the number of engagements (likes, comments, dislikes, shares, etc.), time of publication, text length, page audience size, content type, number of views.
Full text of the research 2020 (English)
Full text of the research 2020 (Russian)
Social Media Users Activity Report 2023
Social Networks Activity Research for 2019
Social Networks Activity Research for 2018
Social Networks Activity Research for 2016
General Methodology
The study is based on an aggregate sample of anonymized data resulting from analyses by Popsters users. Only statistics on 2020 posts were taken into account; data that is irrelevant in terms of the format (IGTV and stories) and retrospective data for older dates were excluded. Pages, where the sample of posts is insufficient to be correctly accounted in the statistics, were not considered as well.
The Telegram statistics was calculated based on the views count, as the commonly used engagement metrics are not available there (likes, comments, etc. are not widely used).
The study results are divided into 7 sections:
• Audience activity by days of week
• Audience activity by hours of day
• Audience activity by text length
• Audience activity by text length / days of week
• Audience activity by text length / hours of day
• Audience activity by content type
• Average Engagement Rate by follower count
The detailed methodology is disclosed in the full (PDF) version of the study.
Interpretation of the Results
For all the sections, the data is displayed in a bar chart where each bar corresponds to an individual indicator as a percentage of the total (100%). Accordingly, this needs to be taken into account when comparing different indicators. For example, the actual difference in Instagram audience activity as compared between Monday and Thursday (15.1% and 14.7% of the total, correspondingly) is not 0.4% but 15.1/14.7*100%, i.e.almost 3%. As compared, to the Sunday activity, the difference is as much as 19%. For convenience, this difference is highlighted in a separate field for almost all charts.
It’s worth noting that the results show the activity for the entire social network as a whole and may not be so relevant to each individual page. In such a case, it is recommended for practical purposes to evaluate the activity individually (can be measured using Popsters).
Results
Here we will show the most interesting observations from the changes of 2020. For more details on social media, see the full version.
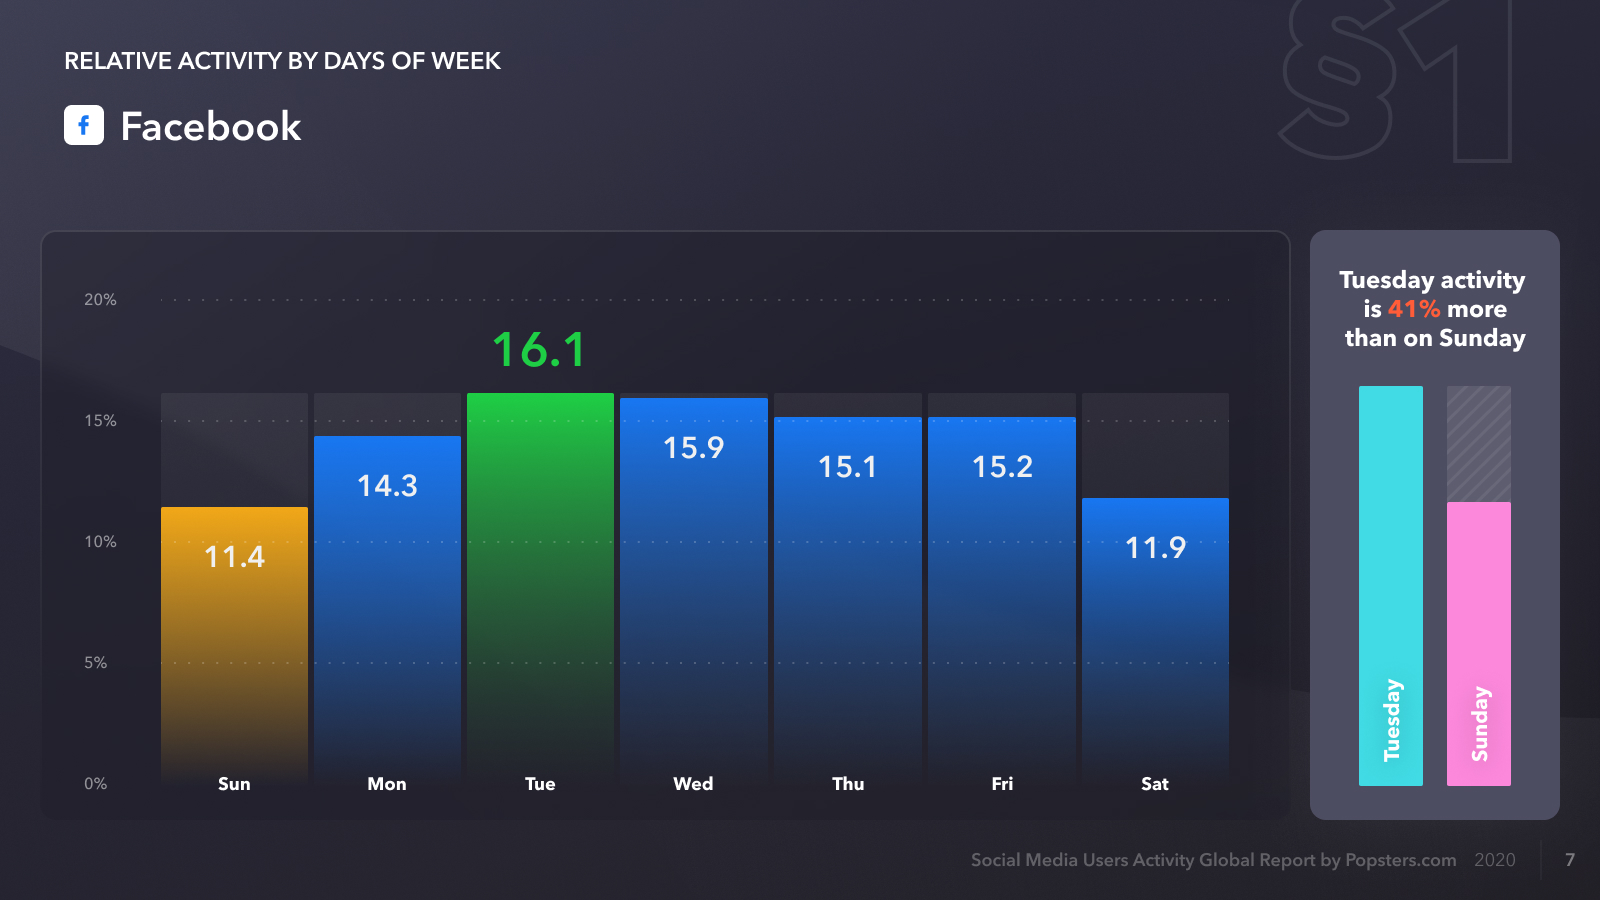
The behavior of Facebook users changed significantly: while the most active day in 2019 was Sunday and a decrease was seen at midweek, now it is vice versa: Sunday and Saturday are the least active days and Tuesday is the most active.
The activity on Instagram in 2019 was about the same throughout a week. Now the difference became vivid–the activity is 19% lower during weekends.

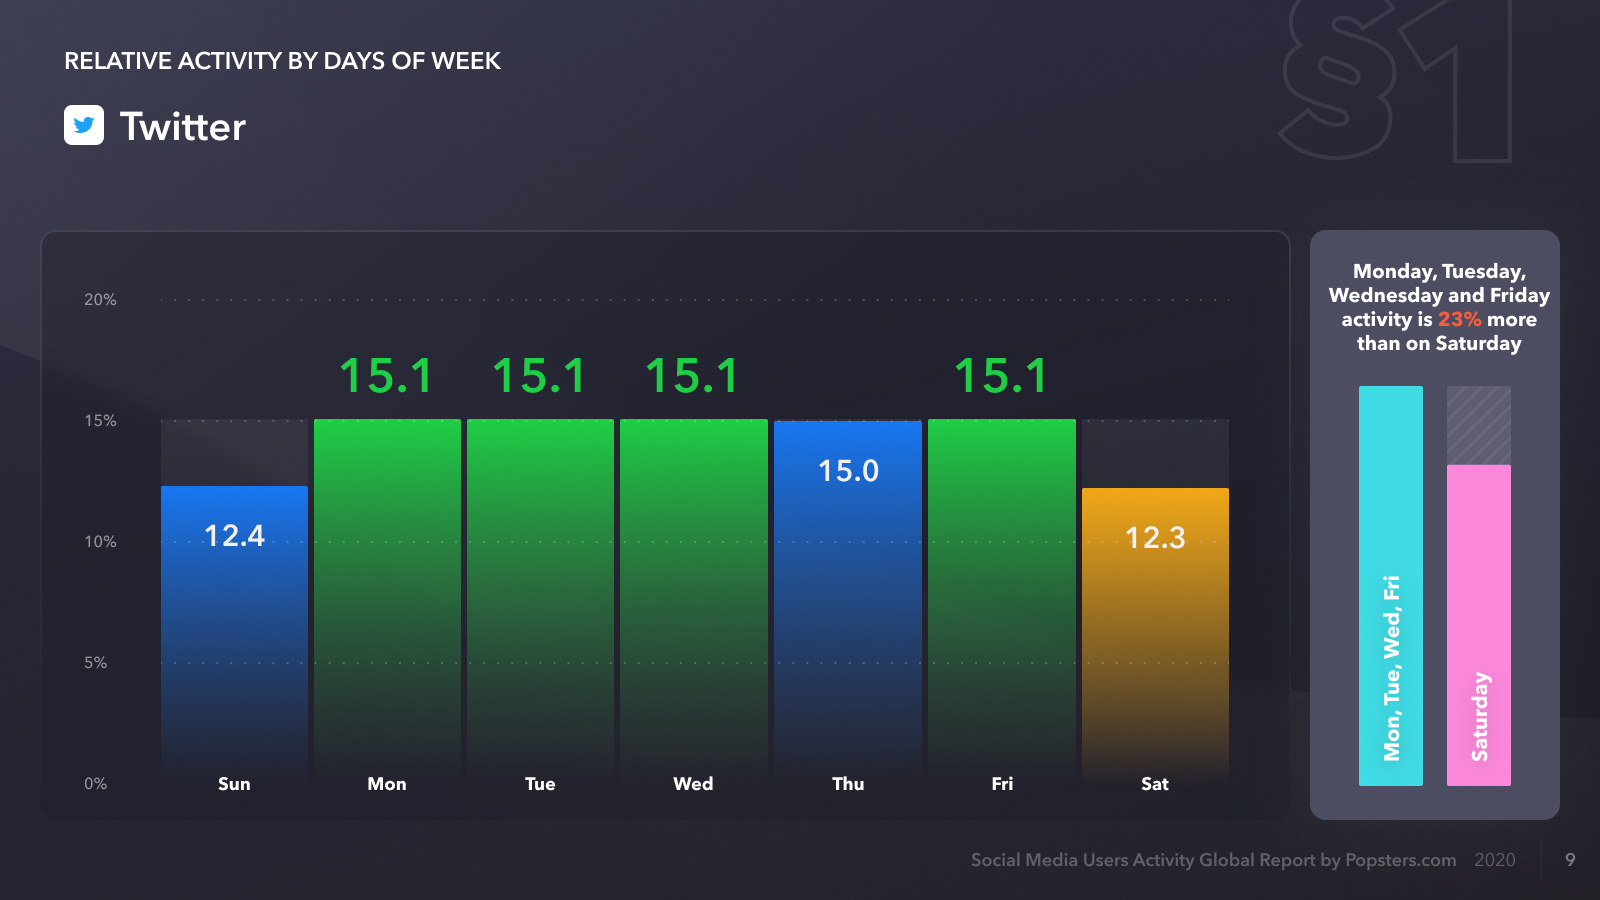
The trend for Twitter is similar: previously weekends saw a significant rise in activity and now the situation is the opposite.
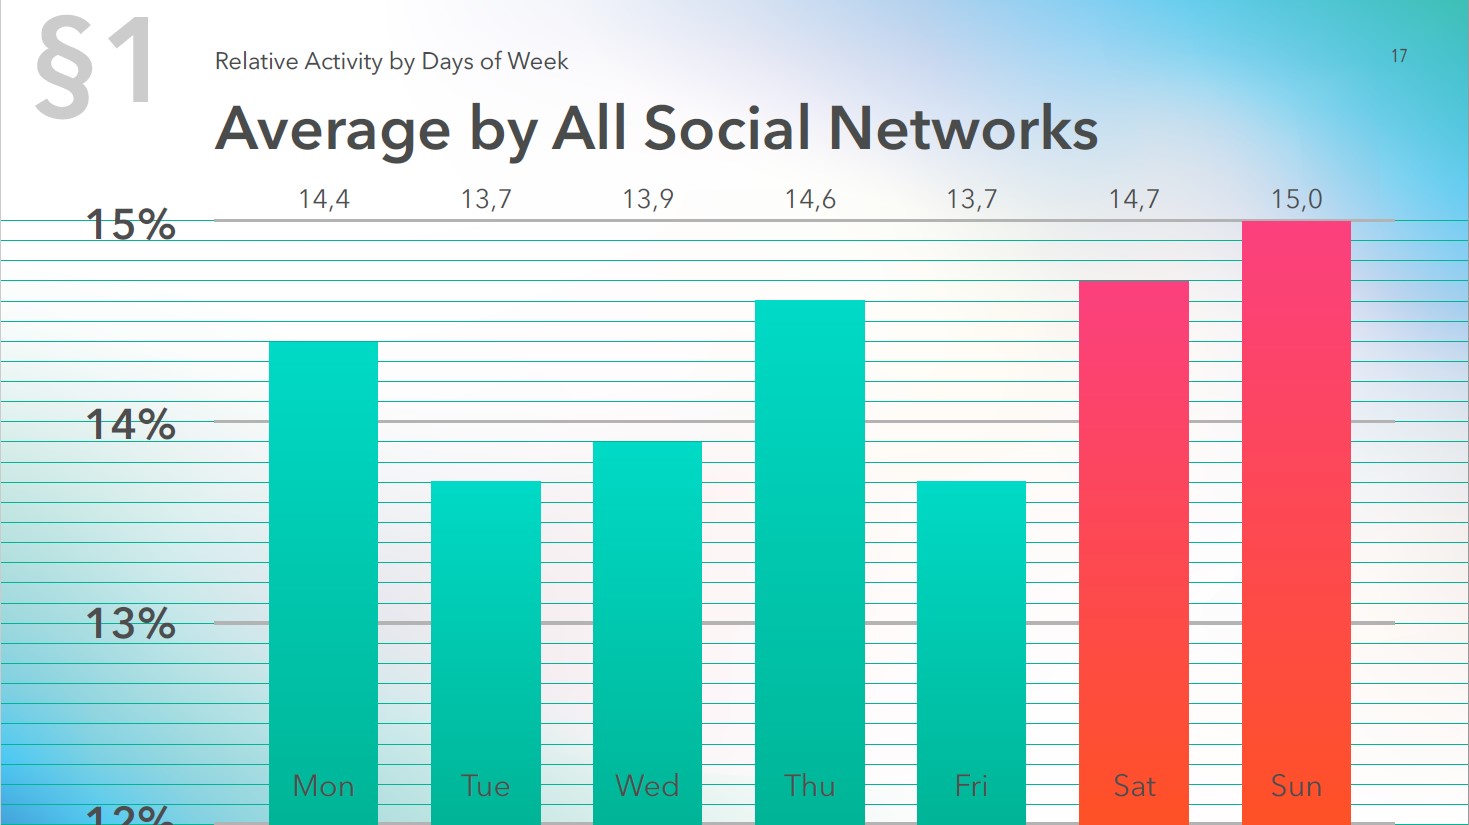
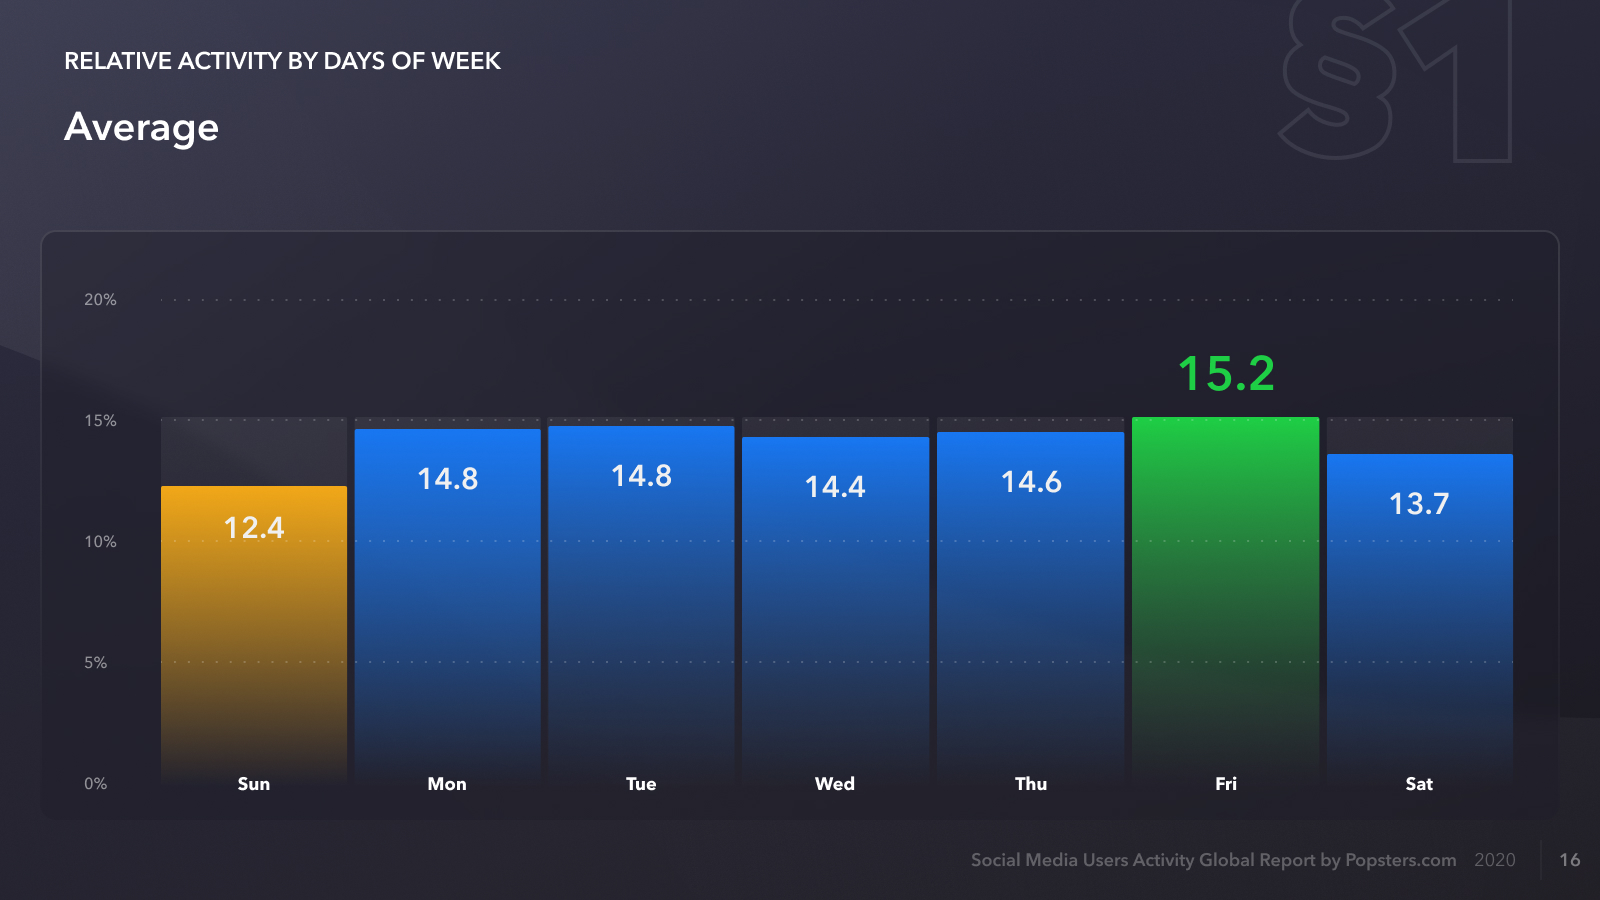
The situation, as averaged over all the social media, looks the same. In 2019, Saturday and Sunday were noticeably more active than weekdays. Now the weekend activity is below average (the chart compares the 2019 study and the current one).
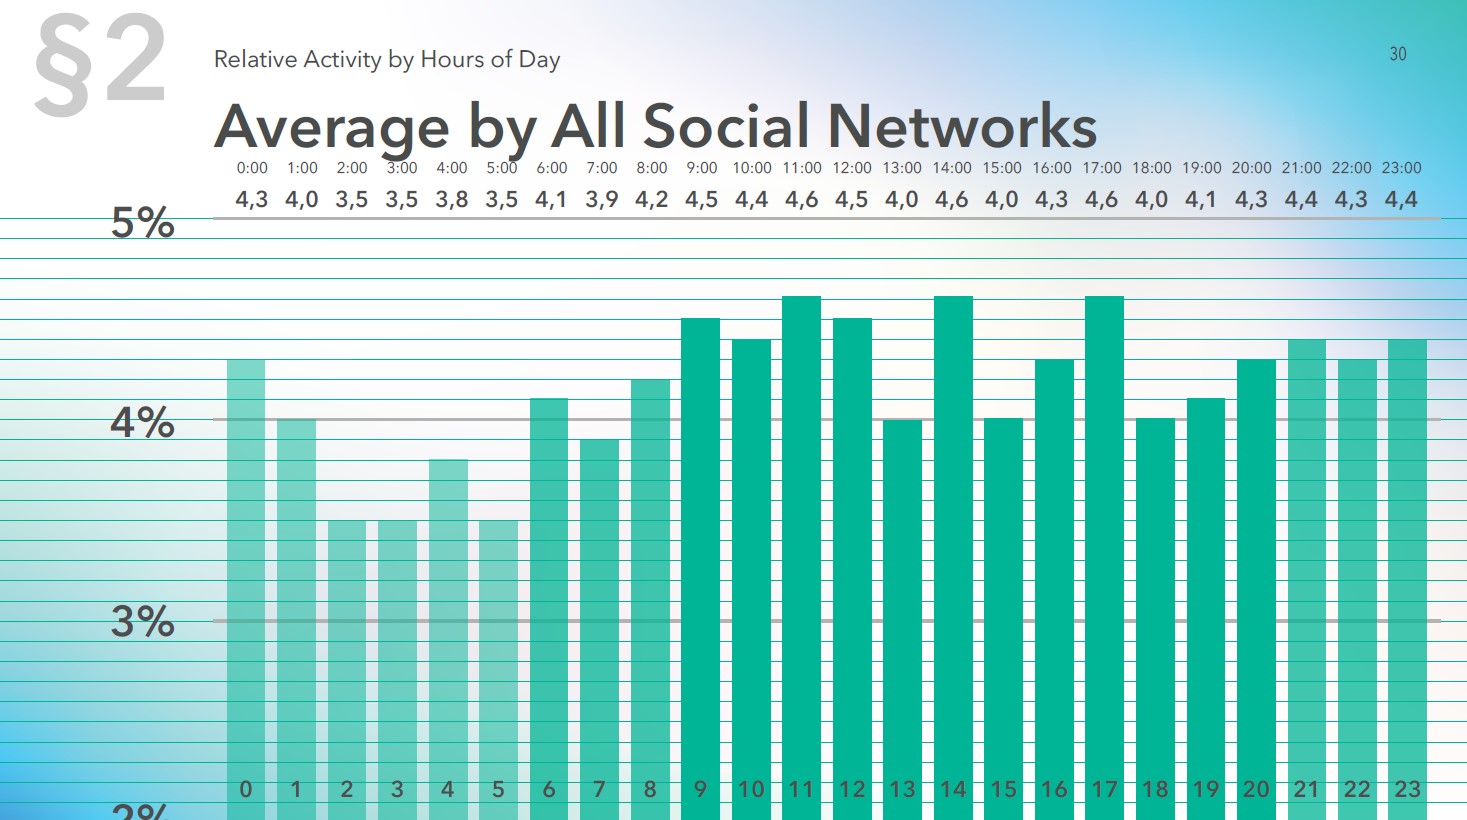
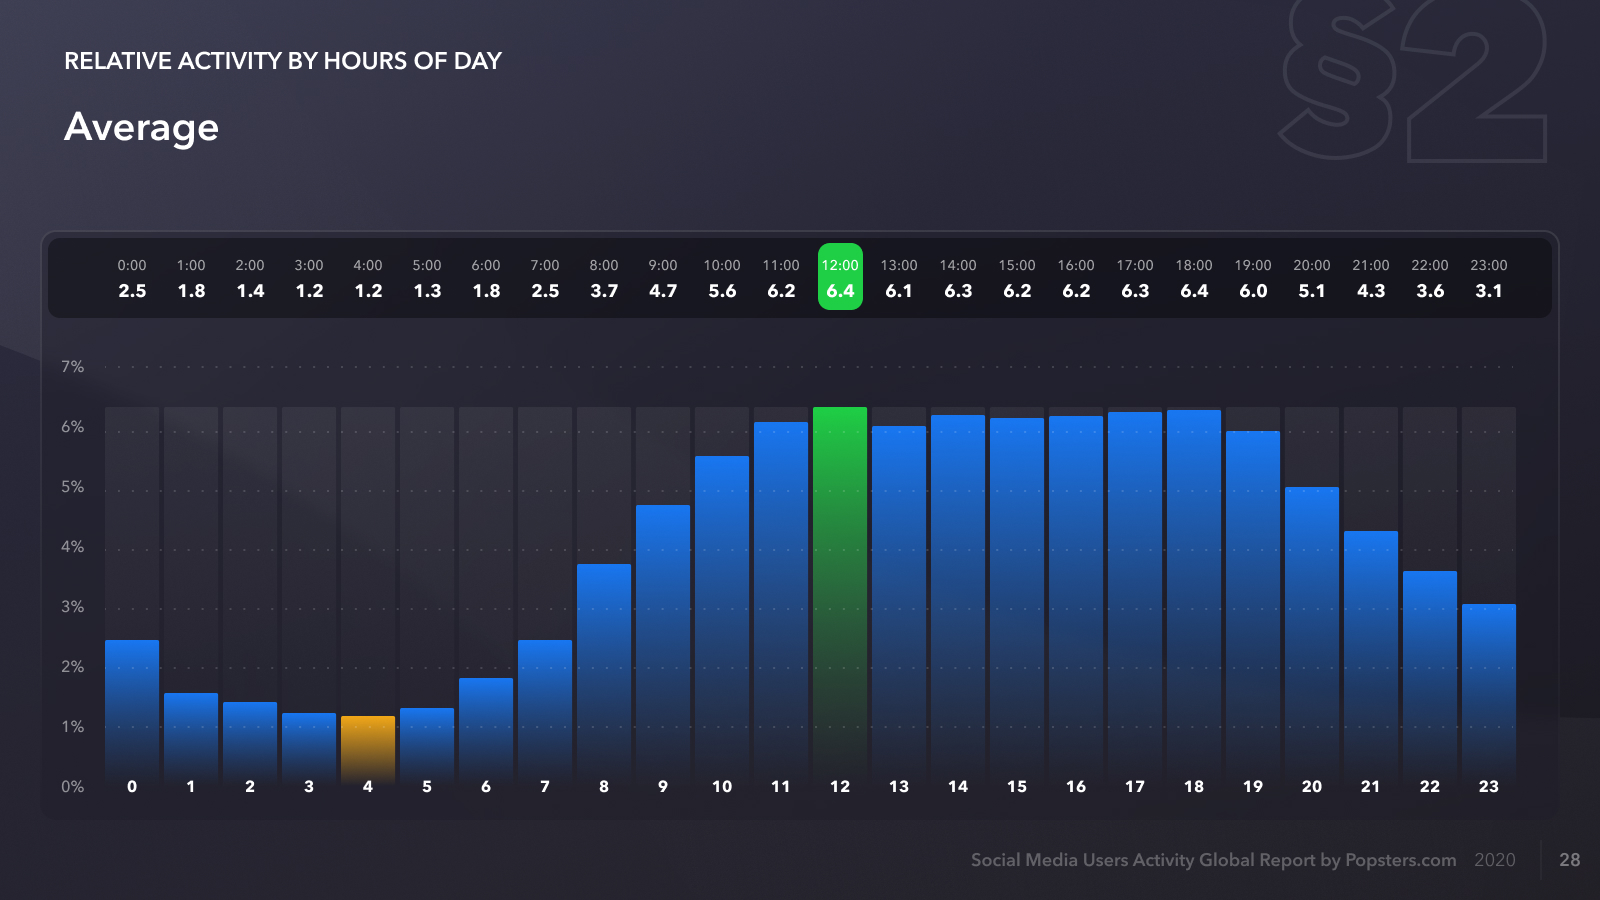
Activity by hour has also changed significantly –the difference in activity between day-time and night-time posts in 2019 was narrow, not exceeding 25%, which could be explained by effects of the algorithmic feed. Now the nightly activity is seen to fall drastically for every individually and on average, with 2- to 5-time difference (by as much as 400%).
The 2019 and 2020 data are visualized below:
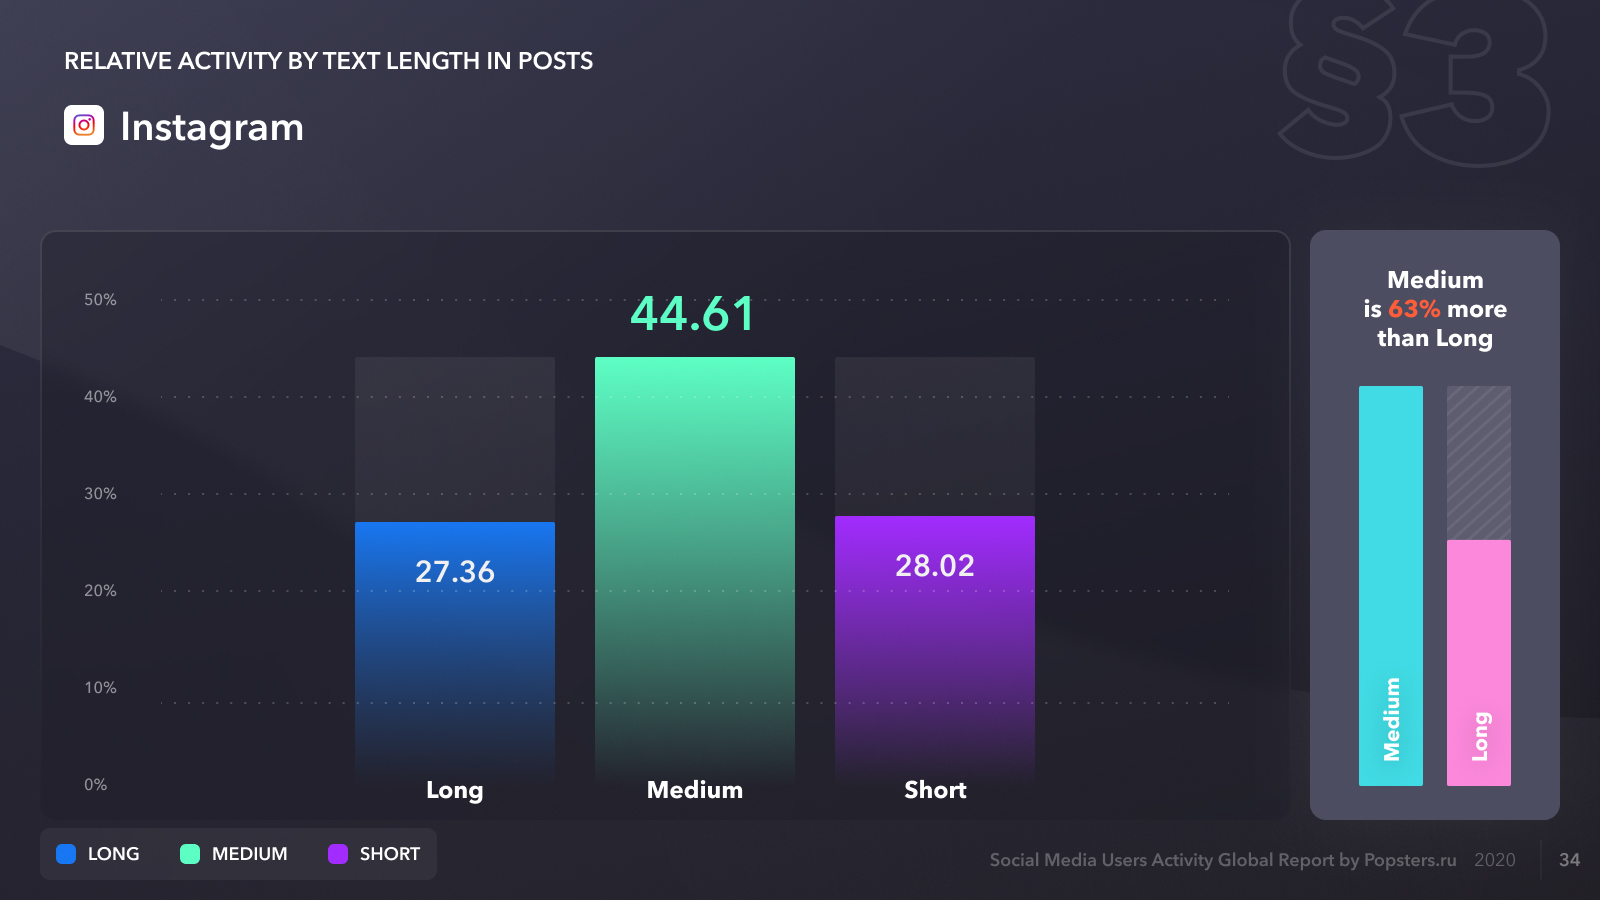
The text length preferences did not change for VK users, with short texts gaining more popularity. At the same time, the proportion has changed for Facebook and Instagram –previously posts with medium (for Facebook) and long (Instagram) texts enjoyed higher engagement, while in 2020 these are posts with short and medium texts, accordingly.
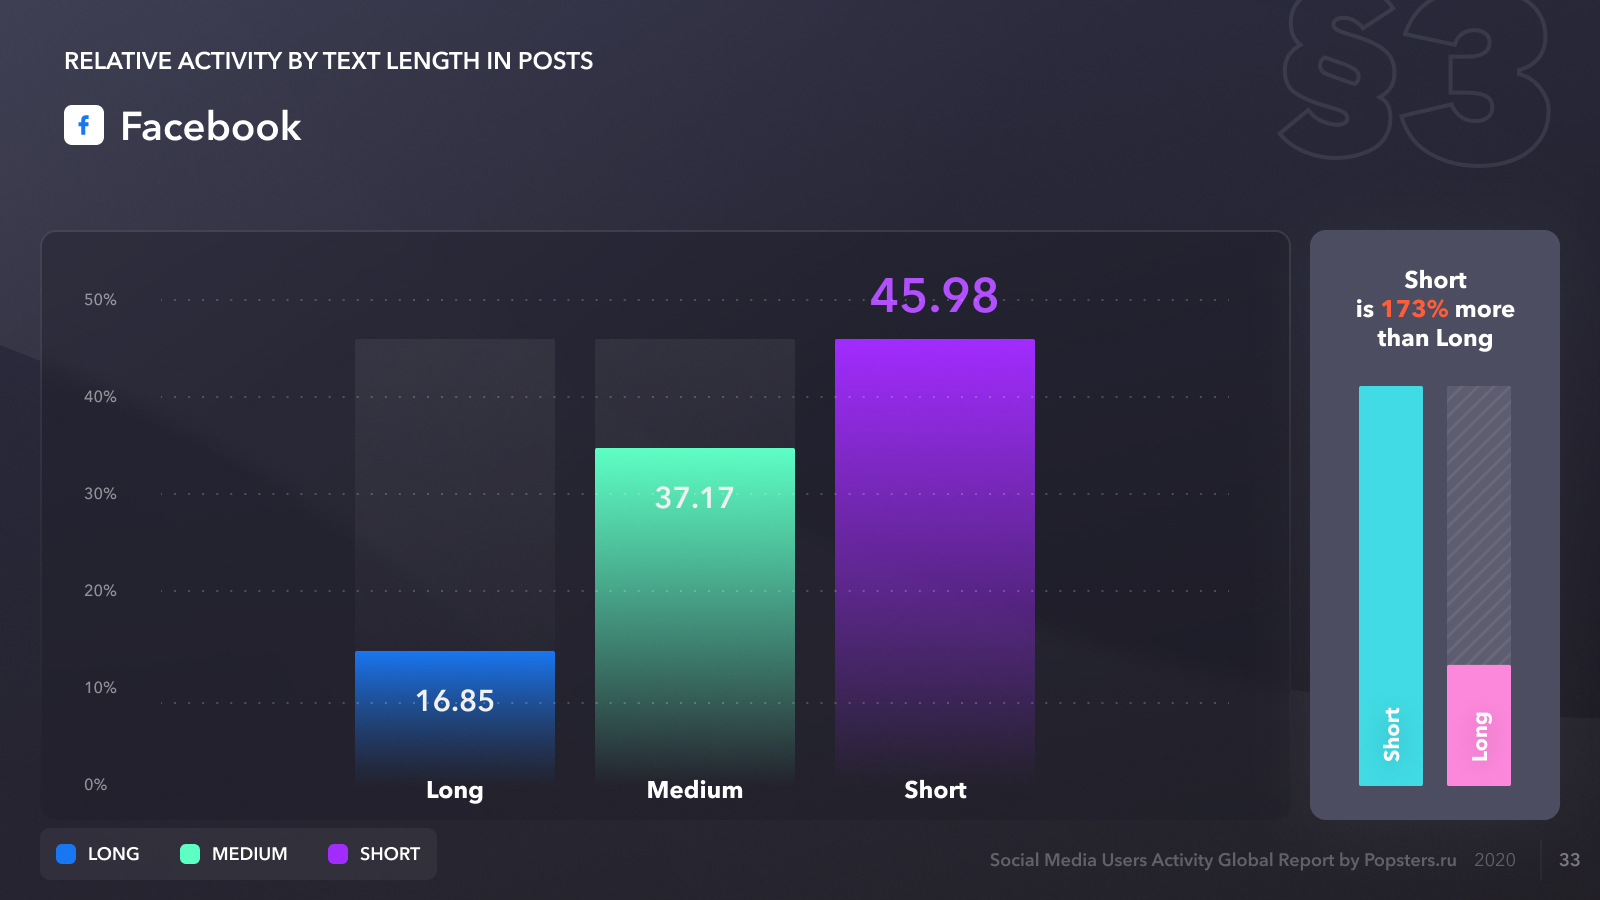
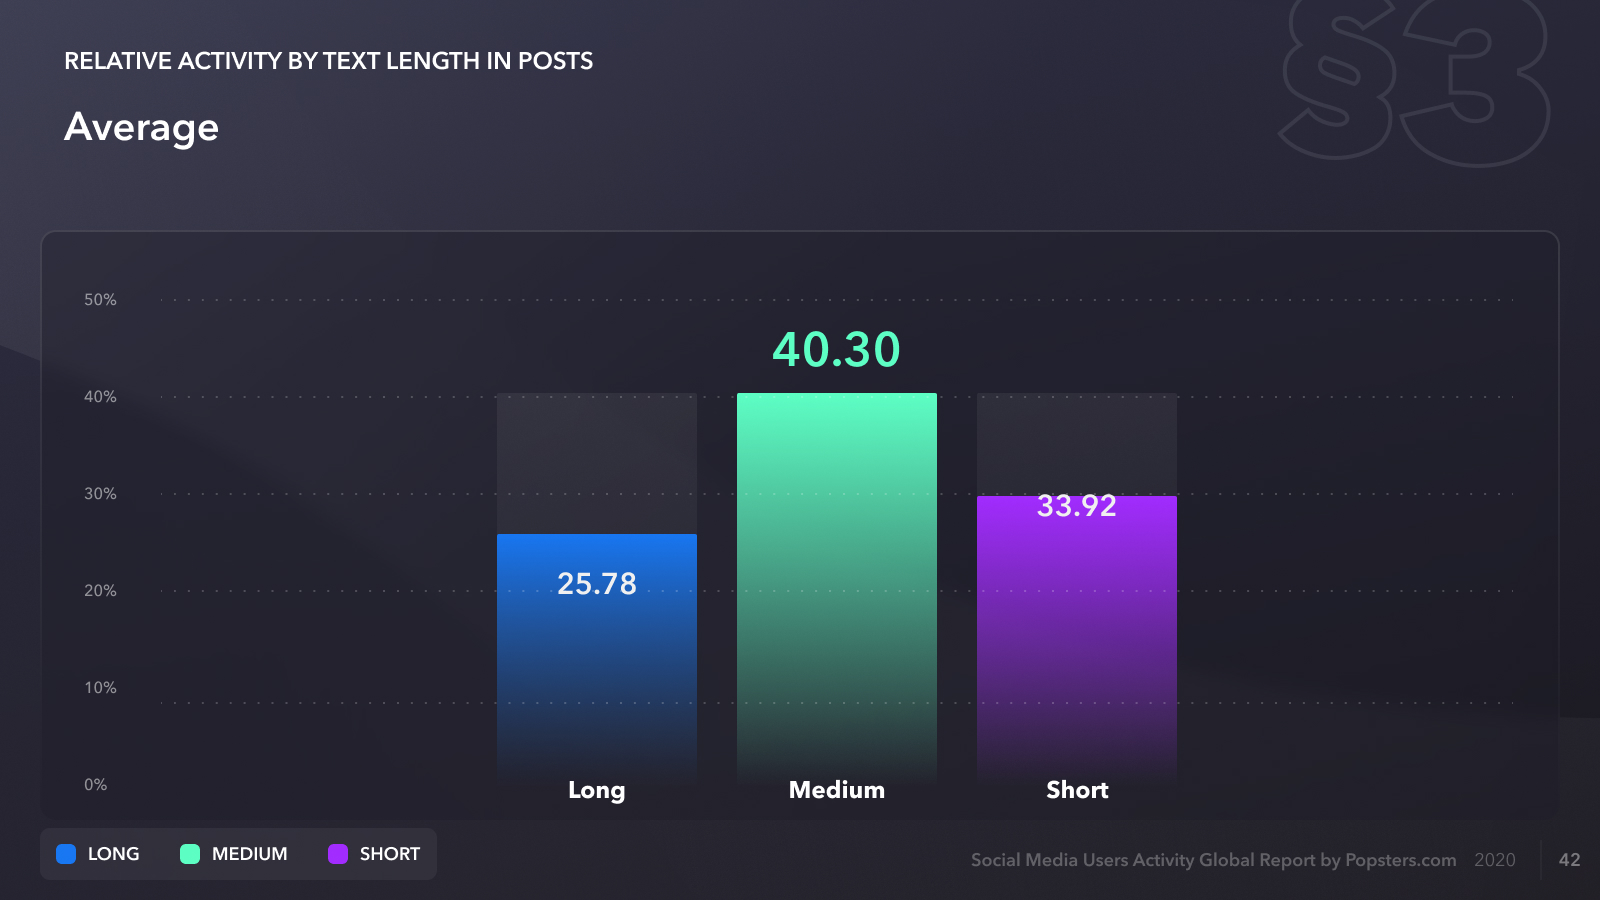
The audience doesn’t like long-reads any more – their engagement has dropped significantly from the activity top for all the social media in total. The highest activity is received by medium-length posts (160 to 1000 characters), with the engagement count being 56% higher than for posts with a long text and 18% higher than for posts with a short text.
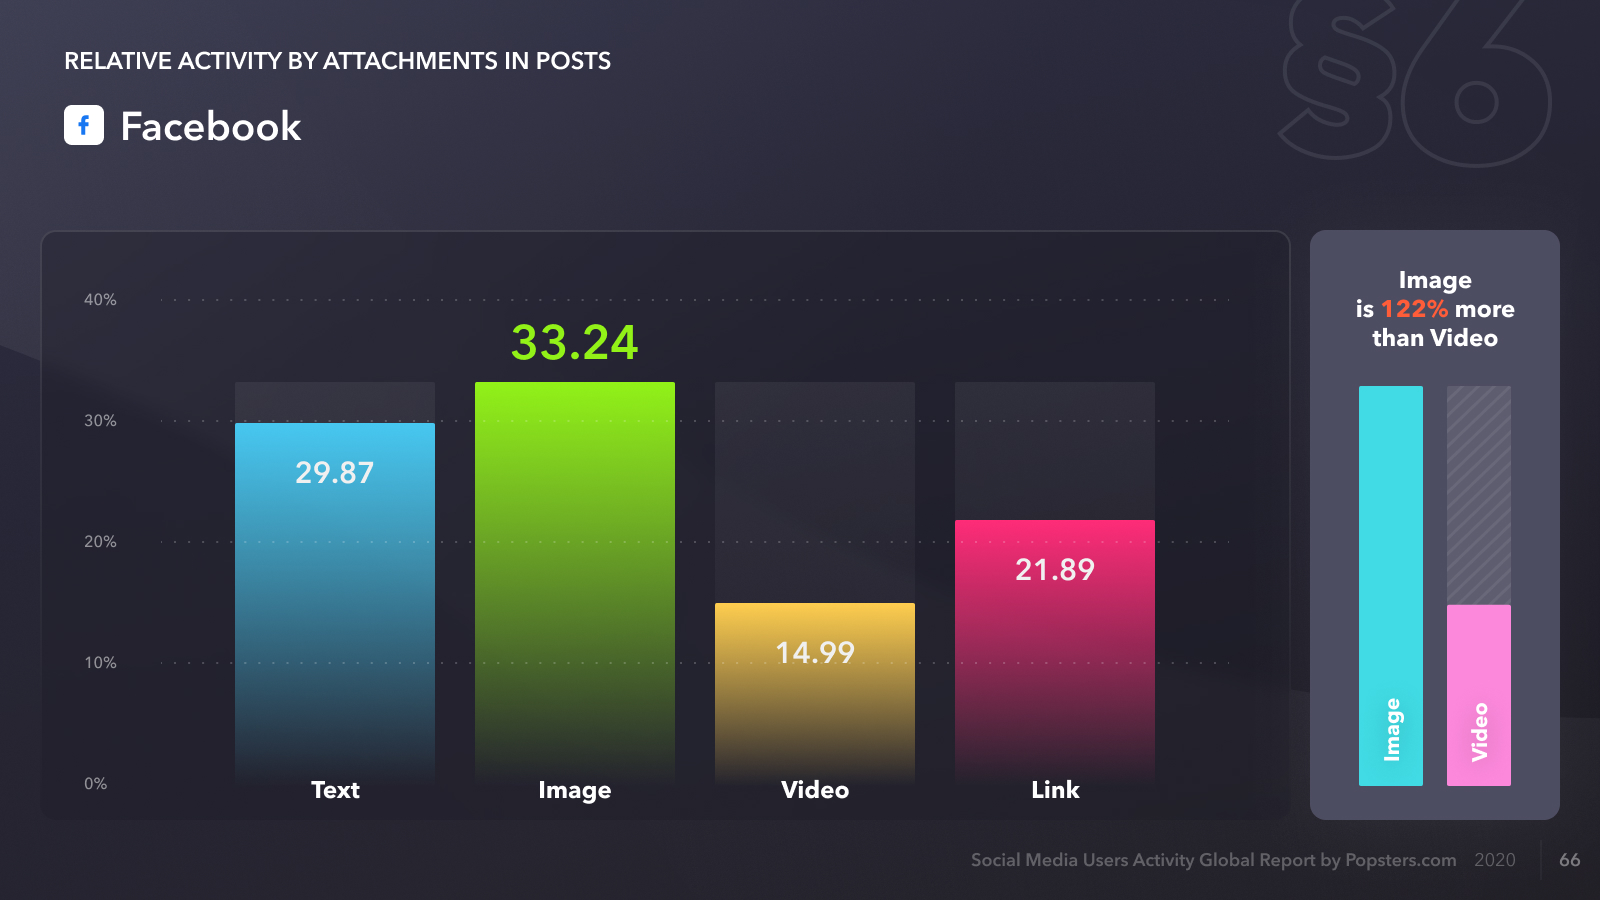
The popularity statistics for the video format has dropped for Facebook, which was previously leading in activity and is now outperformed by posts with texts and images by more than 2 times.
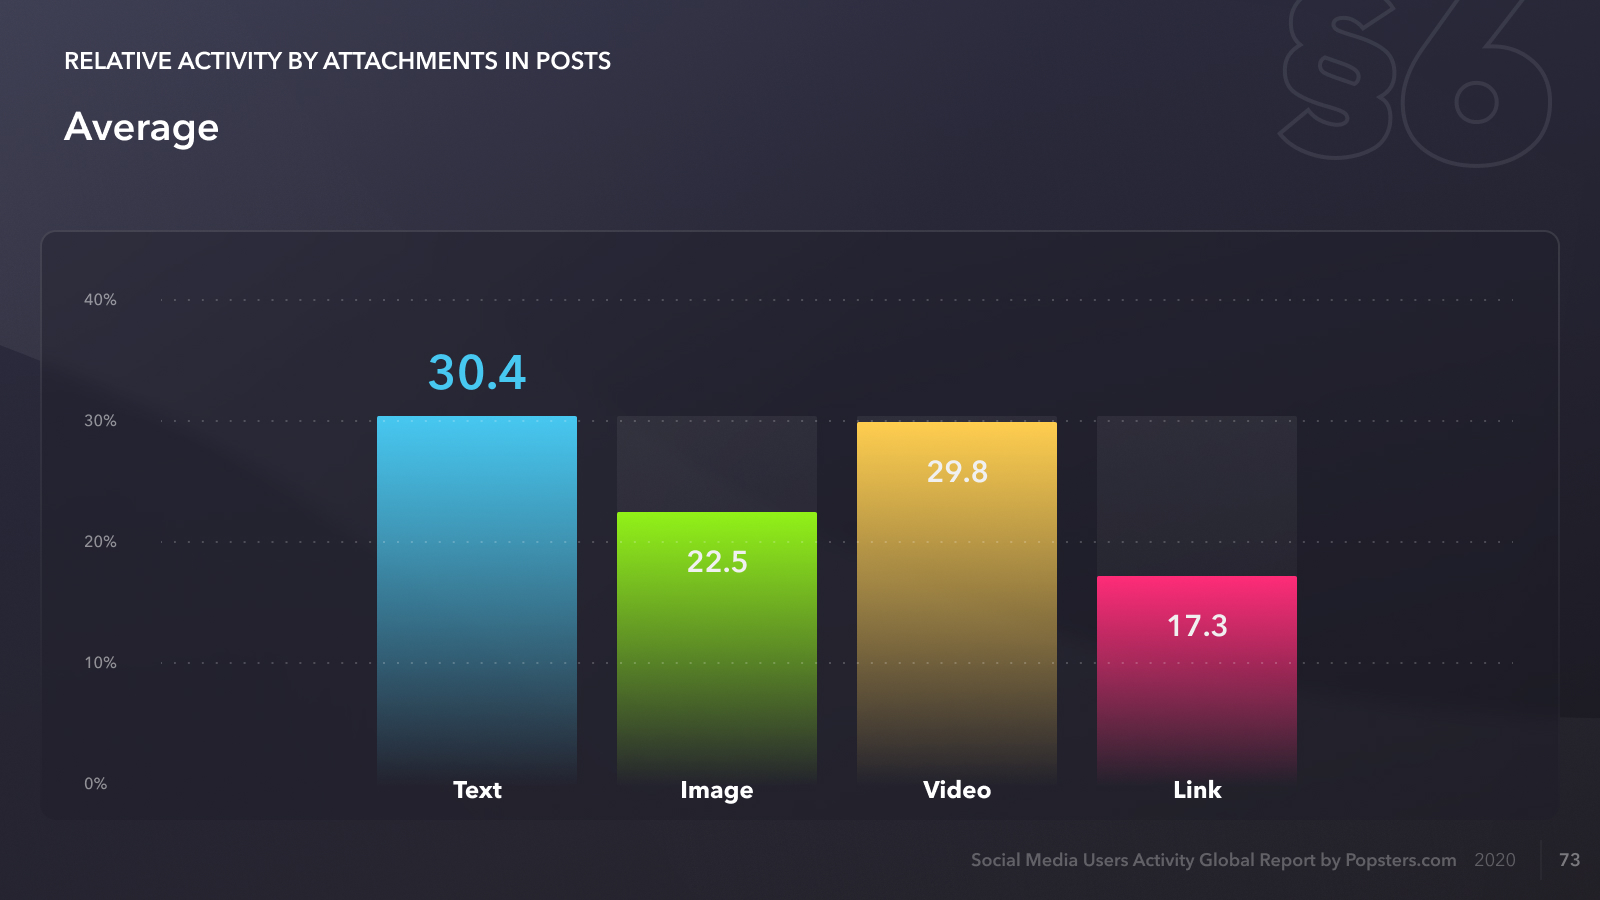
On average, the activity for video decreased in all the social media.
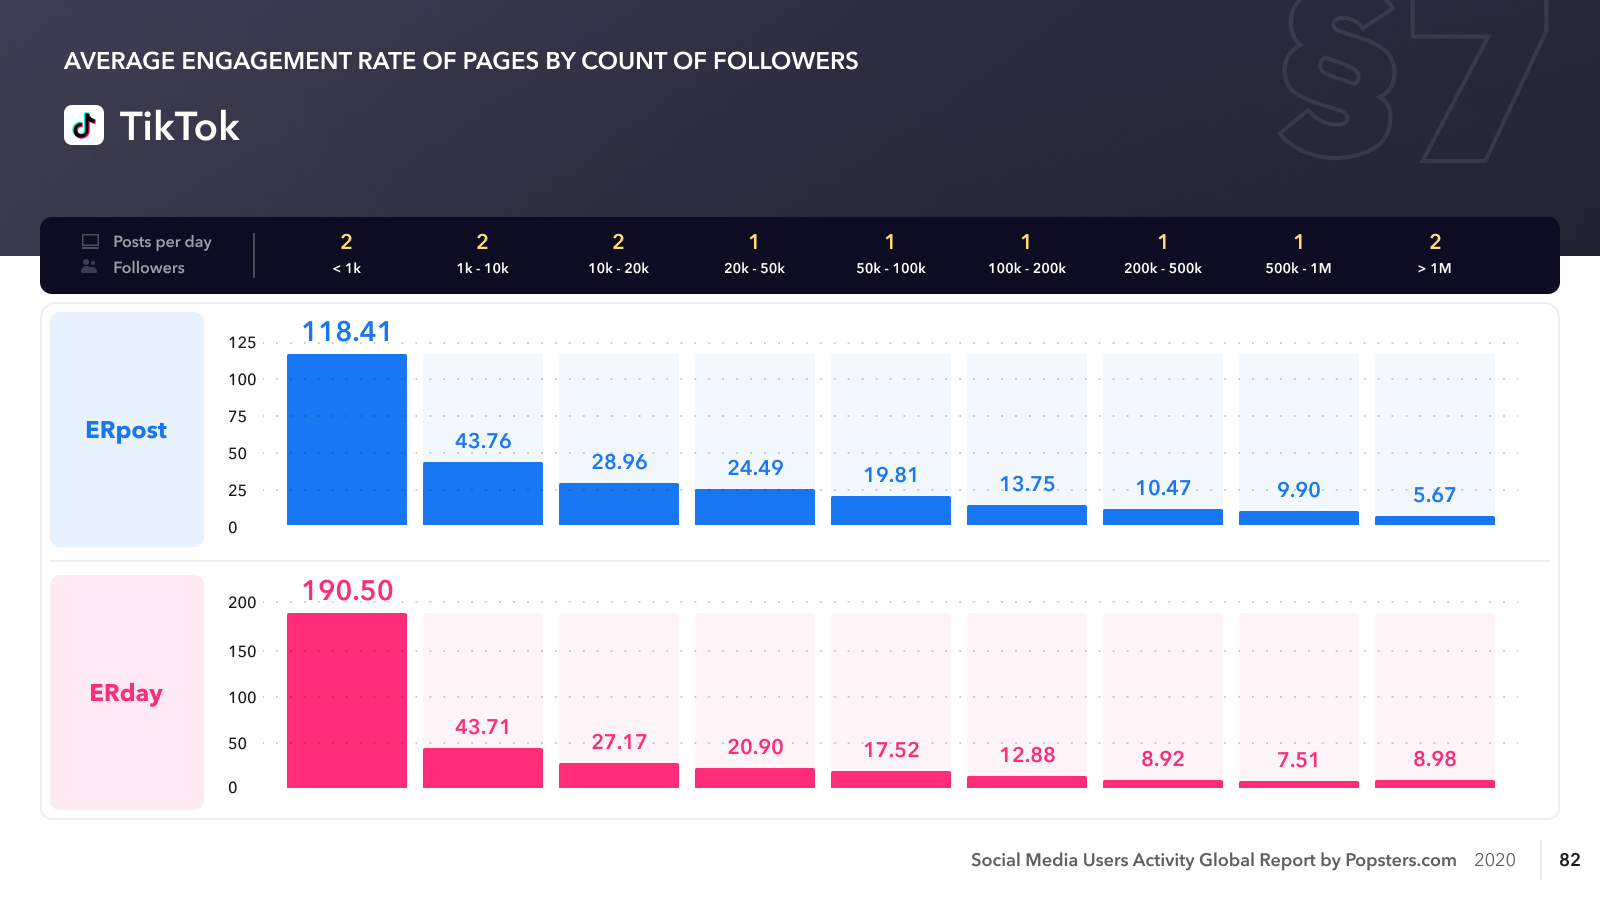
We have not found any fundamental differences in engagement rate charts as compared to the previous year. The general pattern remained at the same level for all social media.
The level of engagement in TikTok is worth noting specifically, as it’s the highest among all the studied social media:
The audience became significantly more active during working hours on almost all of the platforms.
To all appearances, this is due to the fact that audience largely moved to home office in most countries. In 2020, many people worked and studied at home and there were no managers staying behind their back and watching to make sure they have Excel on their monitors and not the Facebook feed. During the lockdown period, the internet became the only way to communicate, which is why people used social media much more actively.
This is supported by the App Anniestudy: In 2020 users spent much more time on social media apps than in 2019. For Russia: The usage ofTikTokhas risen to 17.4 hours a month (from 5.6 hours) per user on average. Instagram took 9.4 hours a month on average, against 7.9 in 2019. VK took 16 hours a month of user’s time in 2020 and 14.3 hours in the previous year. The least change in time is seen for Telegram but even there it increased to 4.6 against 4.5 hours a month.
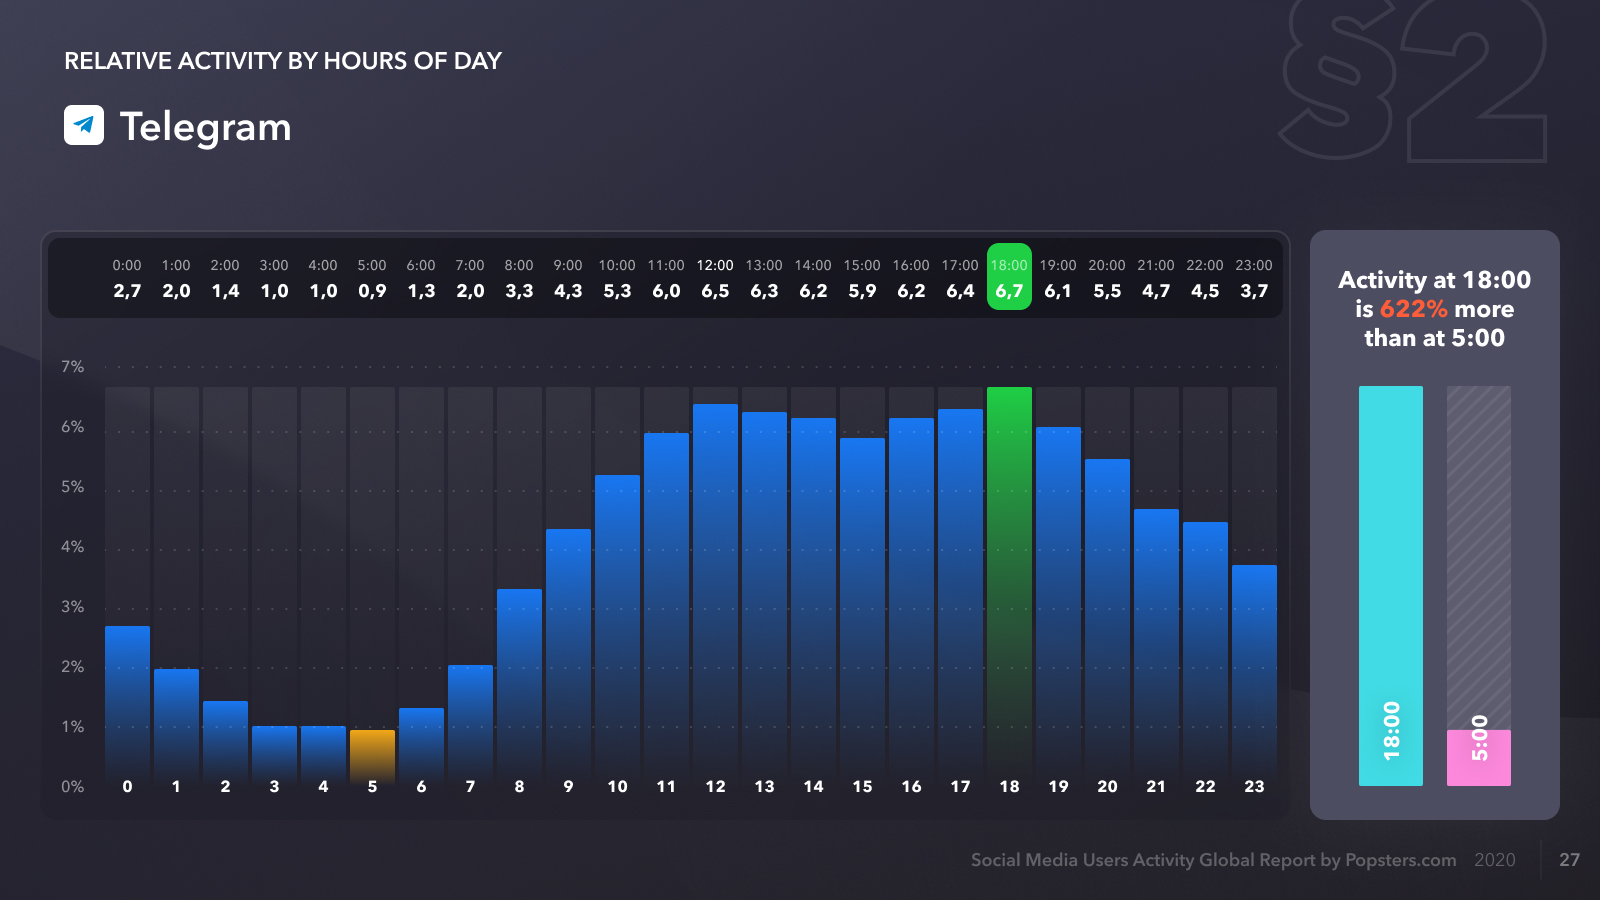
The statistics support our old premise: The time of posting does matter for the engagement. If you still hear claims that the time of posting doesn’t matter in the age of algorithmic feed, just refer to this and previous studies–each time we see clear correlations between the time of posting and the activity. You can see that if you look at statistics for Telegram –a messenger network without algorithmic feed. The Telegram hourly statistics are very similar to other social media in general trends.
The popularity of video decreased for most of social media. Despite its trend towards videos and animations, Instagram, being the main photo-sharing platform, still performs best for static images.
However, the Instagram audience still prefers medium-length descriptions – most engagement is received by posts with 160 to 1000 characters, while long-reads (posts longer than 1000 characters) are surpassed by short texts (up to 160 characters) by very minor margin, 27.36% of engagement against 28.02% for short texts.
As Instagram remains a photo platform, so Twitter keeps playing its role of a platform for short texts. Although the tweet length limit was extended to 280 characters back in 2017, the audience engages better with short notes – 62% of engagement on Twitter was gained by tweets up to 160 characters in length (this is short length for the purpose of our study).
We expect the trends to stay in 2021: most users will keep working at home and the habit to use social media during the daytime will remain for quite some time.
You can review the results in more detail in the full version, compare them with previous years, and add them to your materials or studies. When publishing materials based on that data, please make sure to give reference to the source.
The material is licensed as CC BY.
Study authors: Arthur Kalyin, Arseniy Kushnir
Text authors: Marina Kolmykova, Arseniy Kushnir
Useful articles on a similar topic:
- Best Ways to Become Popular on TikTok;
- Easy way to view statistics of any Twitter profile;
- How to make a presentation interesting and not boring;
- A useful and convenient Vk profile viewer for analyzing your's and competitor's pages.
Try Popsters Trial plan to get content activity statistics of any pages for a next 7 days for free
Try for free
Popular
-
 YouTube Analytics and Statistics for Other Channels
-
 Instagram Statistics and Analysis: How to View Data of any Account
-
 Analytics and Statistics for Any Telegram Channel or Chat
-
 How to Increase Telegram Subscribers: Best Free Ways
-
 How to Remove fake Followers on Instagram and Is It Necessary?
Try Popsters Trial plan to get content activity statistics of any pages for a next 7 days for free
Try Popsters