Social Media Audience Activity Global Research 2022
Introduction
Every day Popsters users analyze thousands of pages from a wide range of social media: some use the service as a tool to gather statistics for a report, some need to carry out a competition analysis, many use the service as an aid to analyze audience preferences and prepare a content plan. Such analysis shows one or several pages loaded and barely reveals interests of the social platform’s audience. That is why we publish this annual study report of social media users’ activity in 2021, aggregating data for pages from all over the world.
The statistics were calculated based on over 302 million posts in 1,382 thousand different pages analyzed by Popsters users in 2021 on 8 social media: Instagram, Facebook, OK, VK, Twitter, Telegram, YouTube and TikTok.
Full text of the research 2021 (English)
Full text of the research 2021 (Russian)
Social Networks Activity Research for 2020
Social Networks Activity Research for 2019
Social Networks Activity Research for 2018
Social Networks Activity Research for 2016
General Methodology
The study is based on an aggregated sample of anonymized data from the results of analyses by Popsters users. Only posts made in 2021 were taken into account; irrelevant formats (IGTV and stories) or historical data over older dates were excluded. The data for pages with the main time zone, other than that of the analyst was excluded from the sample. Also, were excluded pages with the sample of posts not big enough to be correctly accounted for in the statistics.
The Telegram statistics were calculated based on the view count for posts, since it doesn’t have used engagement metrics (no mass usage of likes, comments, etc.)
The study results are divided into 7 sections:
- Audience activity by day of the week
- Audience activity by hour
- Audience activity by text length
- Audience activity by text length and day of the week
- Audience activity by text length and hour
- Audience activity by content type
- Average engagement rates by audience size
The methodology is further detailed in the full version of the study (PDF).
Interpretation of the Results
All the sections show the statistical data as a bar chart, where every bar represents an individual indicator as a percentage of the total (100%).
For example, if social media audience activities are 15% for Monday and 16% for Thursday, the actual difference would be not 1% but 16/15*100%, i.e. almost 7%. The difference between the highest and lowest values is shown for most of the charts for convenience.
Since all the data, as analyzed, is output in the local time zone, the final results are to be interpreted in the same way— as the local time.
It should be noted that the results reflect the activity on a social network on the whole and may be irrelevant for an individual page. In that case, for practical purposes it is recommended to evaluate activity for an individual page using Popsters.
Results
Certain pages of the report show general conclusions and comparison with the previous year’s statistics. The text version of the paper may lack some sections for some social media, in which case the results can be seen in the full version in PDF (attached in the beginning of the article).
Audience activity by day of the week
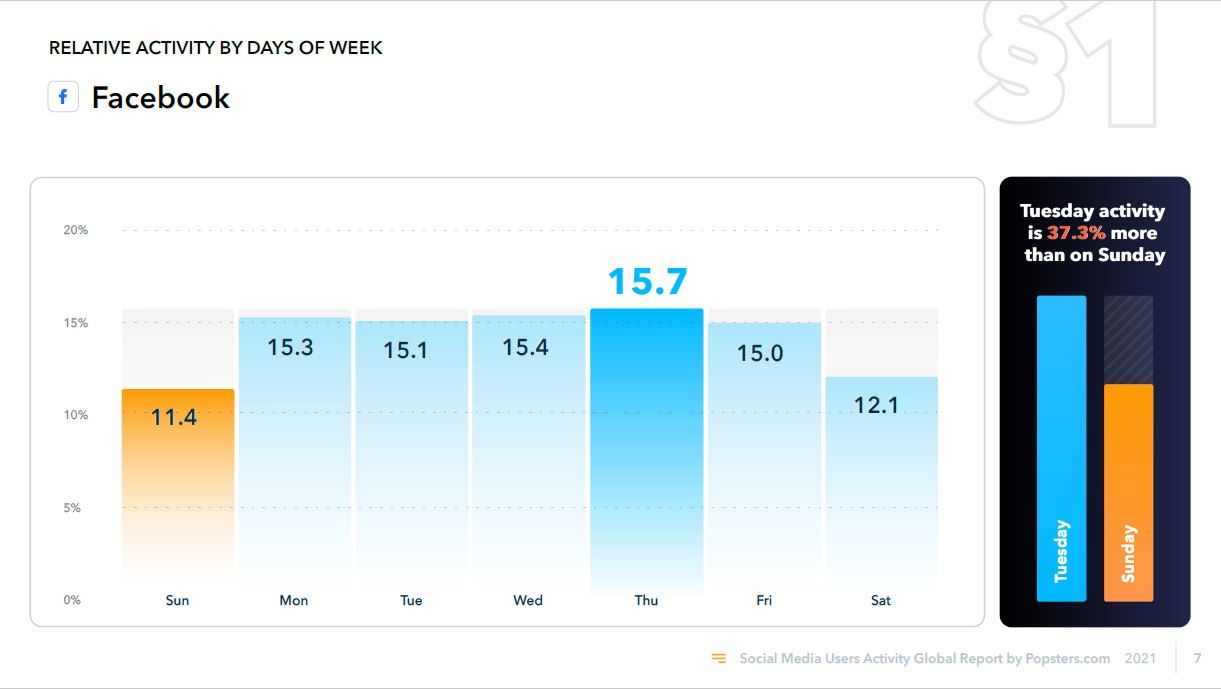
Facebook has seen the weekly activity level equalizing, with the highest level on Thursdays. There were no major differences from 2020 identified.
The most active day for Instagram is Monday, and it is significantly decreased during weekends, with the difference being 37% as compared to Sundays.

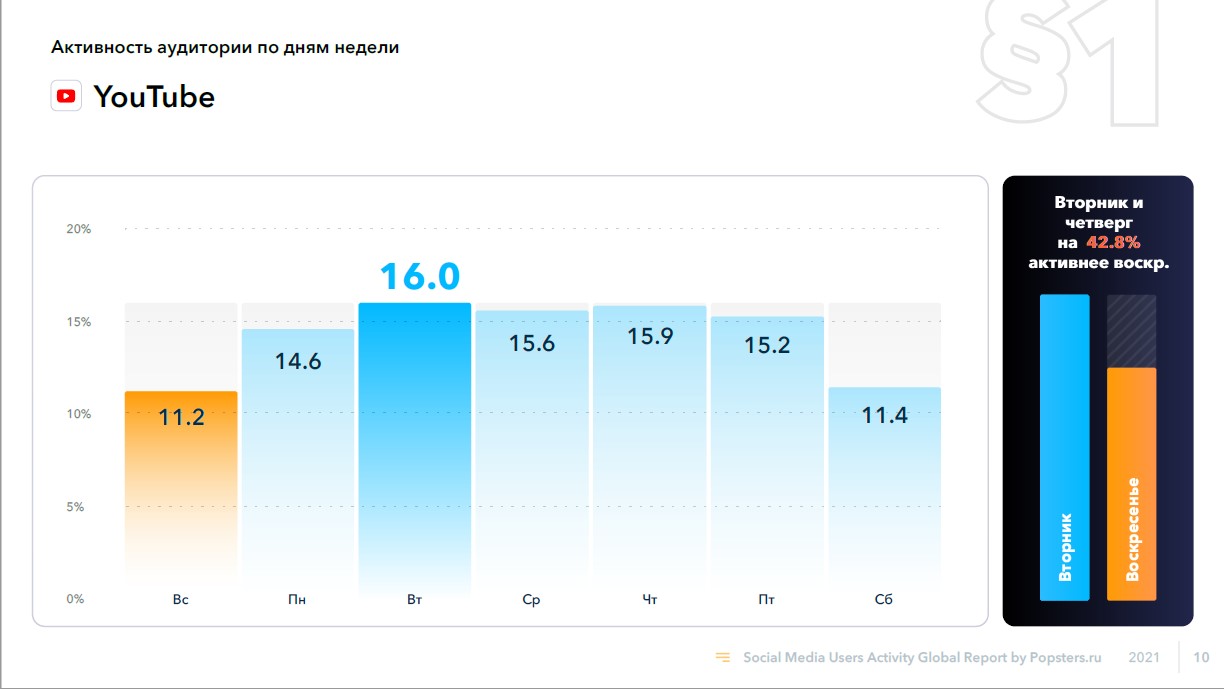
The YouTube’s activity peak shifted to Tuesday, being just a bit higher than Thursday or Friday.
The activities by day of the week for VK, TikTok and OK are almost identical to those for 2020, no major change has occurred.
Audience activity by hour
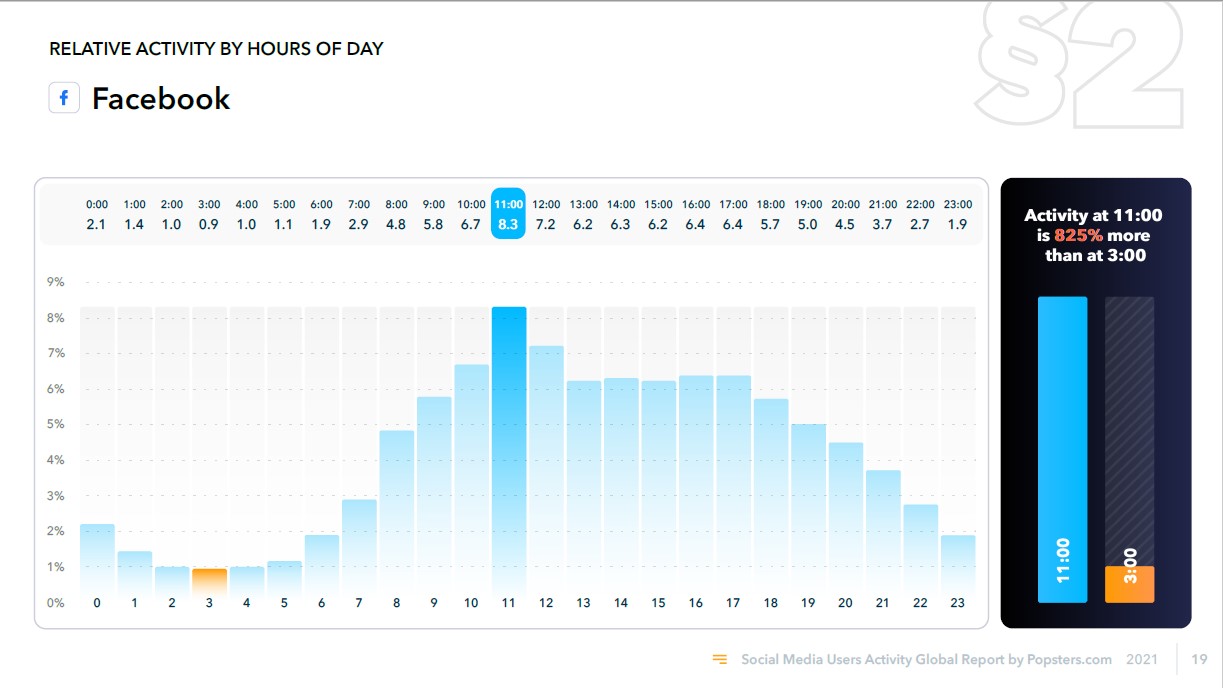
Activity on Facebook raised for the period of 11 to 12 a.m. The lead over the least active hour (3 a.m.) is more than 9 times.
The highest activity on Instagram is with posts published around the midday, and the exact interval doesn’t make much difference, as the activity between 12 a.m. and 6 p.m. is at similar levels.

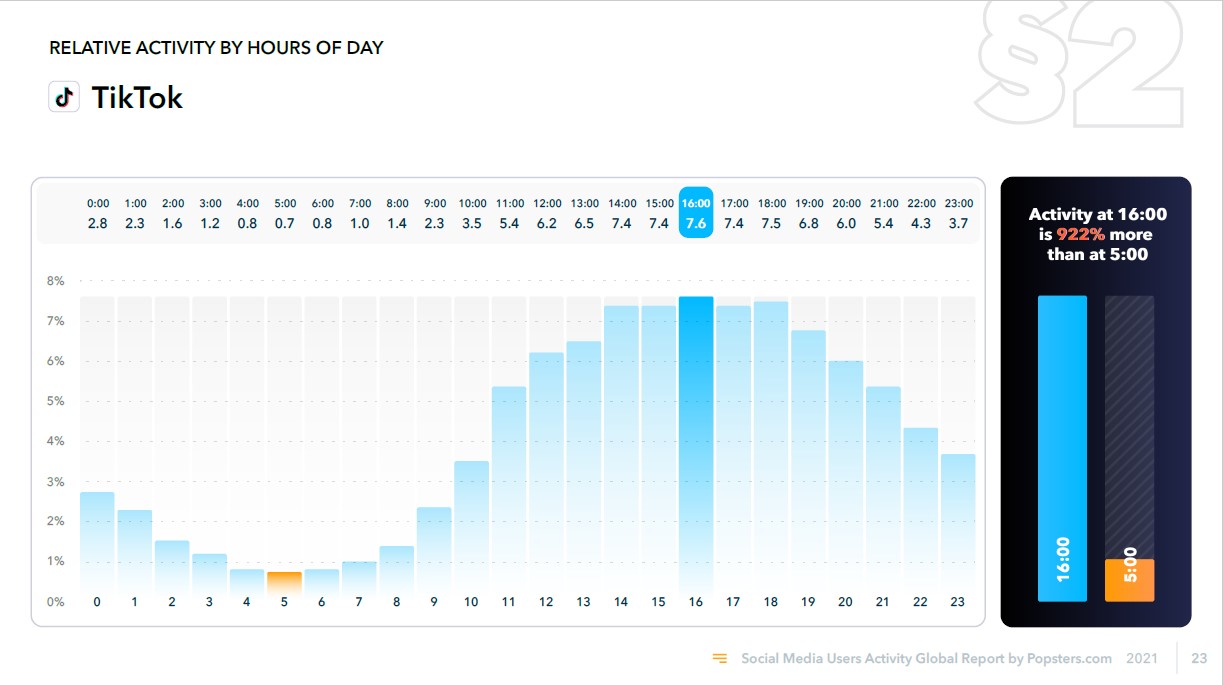
The TikTok’s activity distribution by hour is now more uniform as compared to 2020, with the daytime being the most active, peaking at 4 p.m.
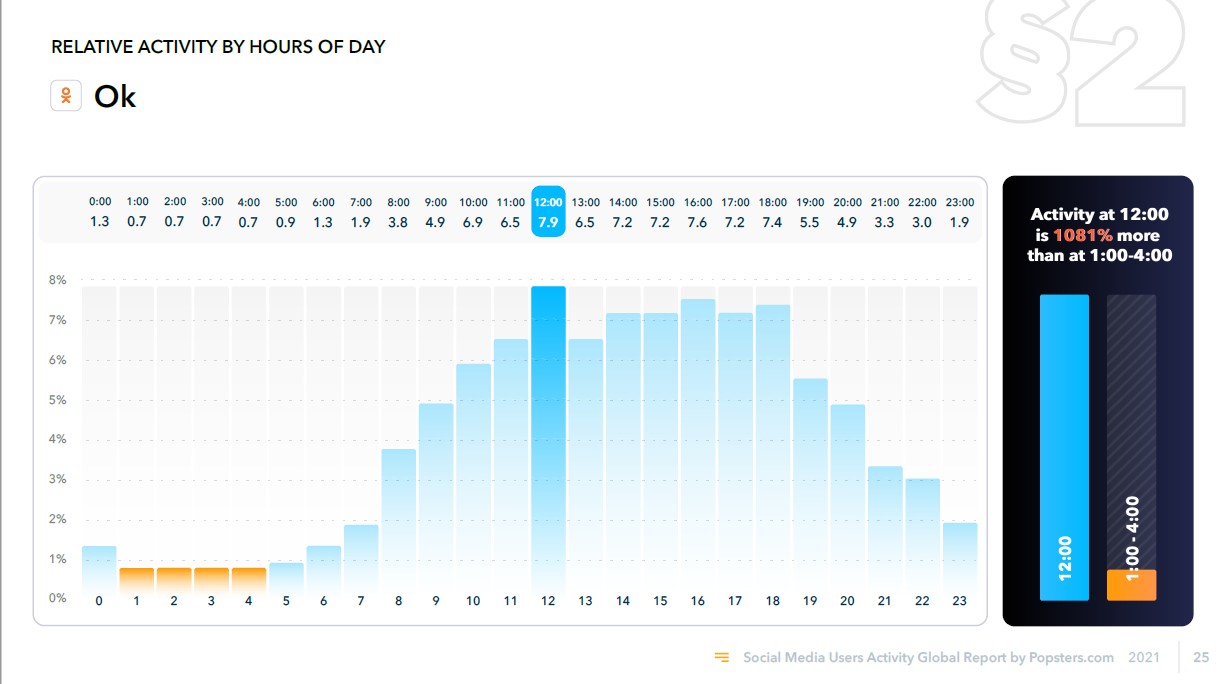
OK sees the highest activity between 12 a.m. and 6 p.m., while the nighttime activity is significantly lower (by up to 10 times).
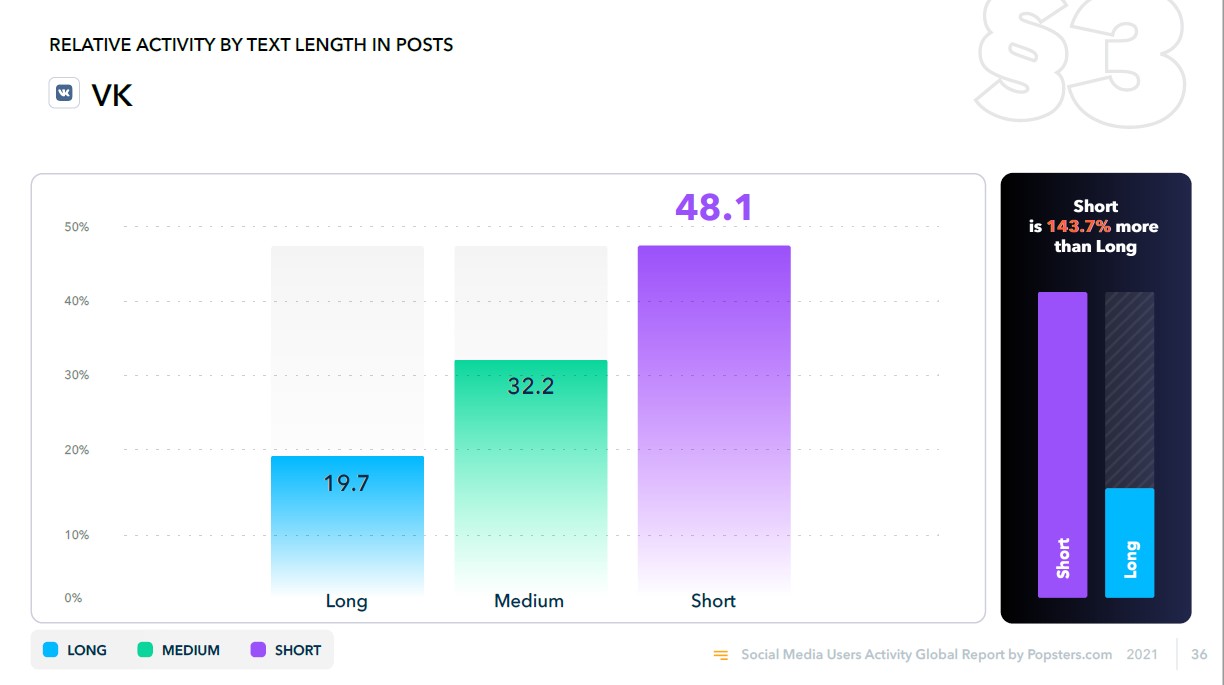
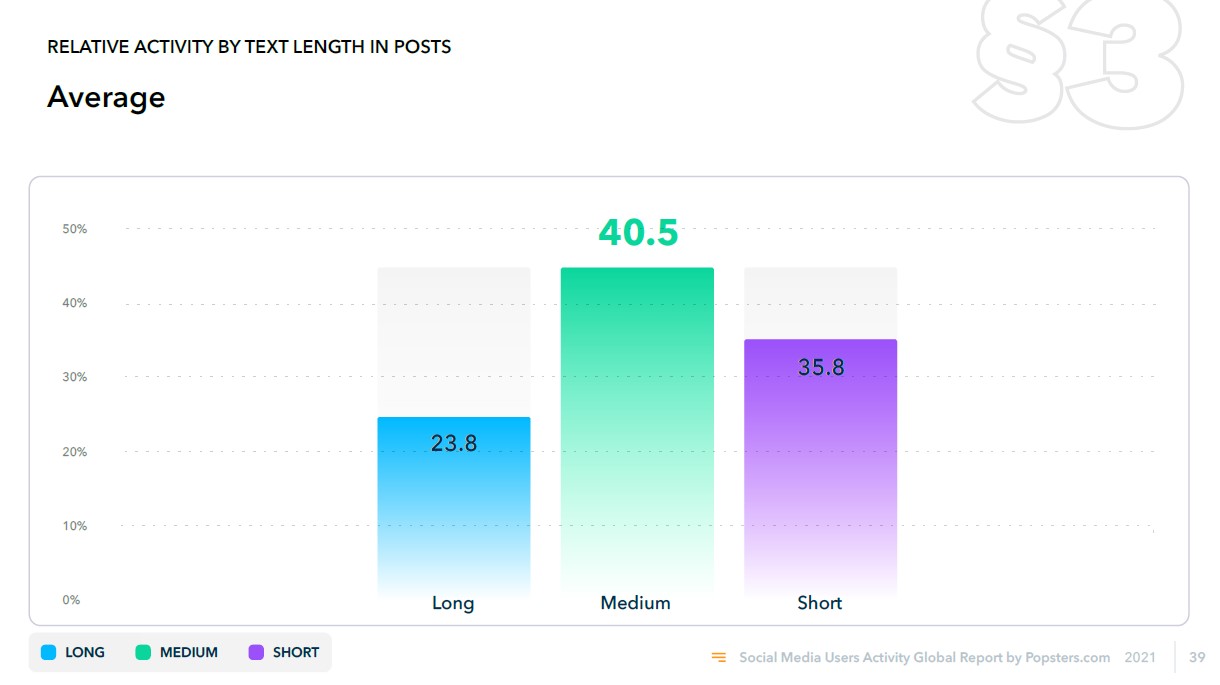
Audience activity by text length
Facebook audience still doesn’t like longreads. Short and simple posts enjoy the highest popularity.

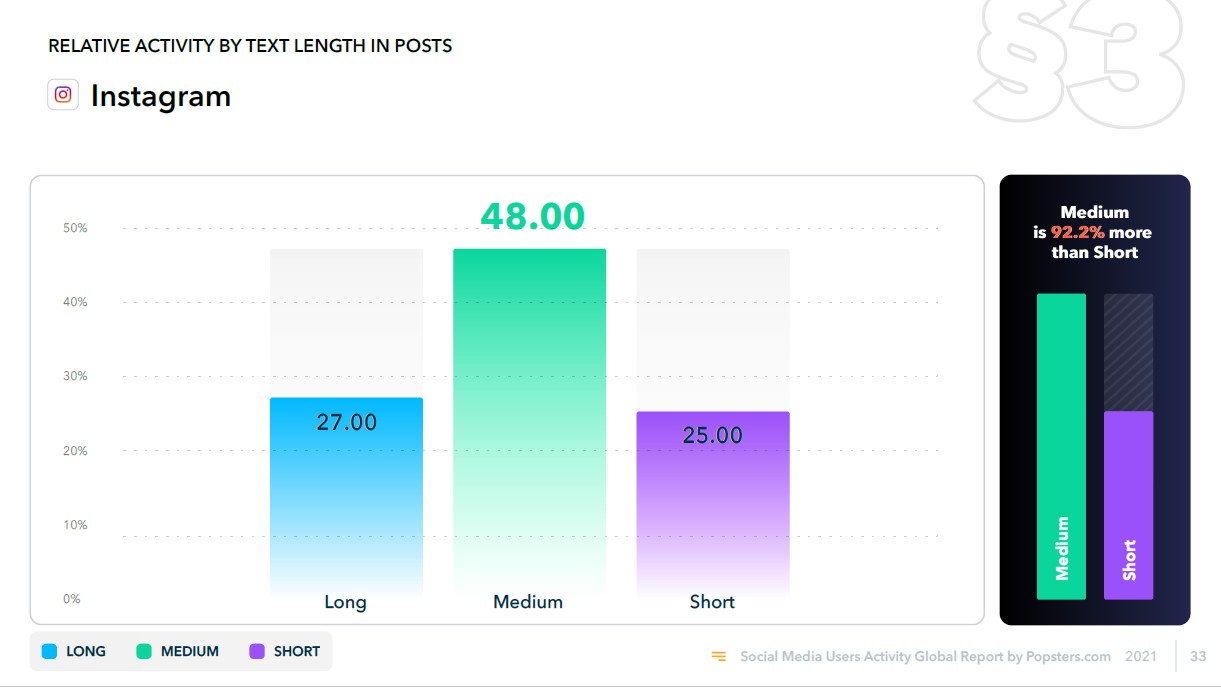
On Instagram, medium-length texts are most popular. They are 77% to 92% above other lengths.
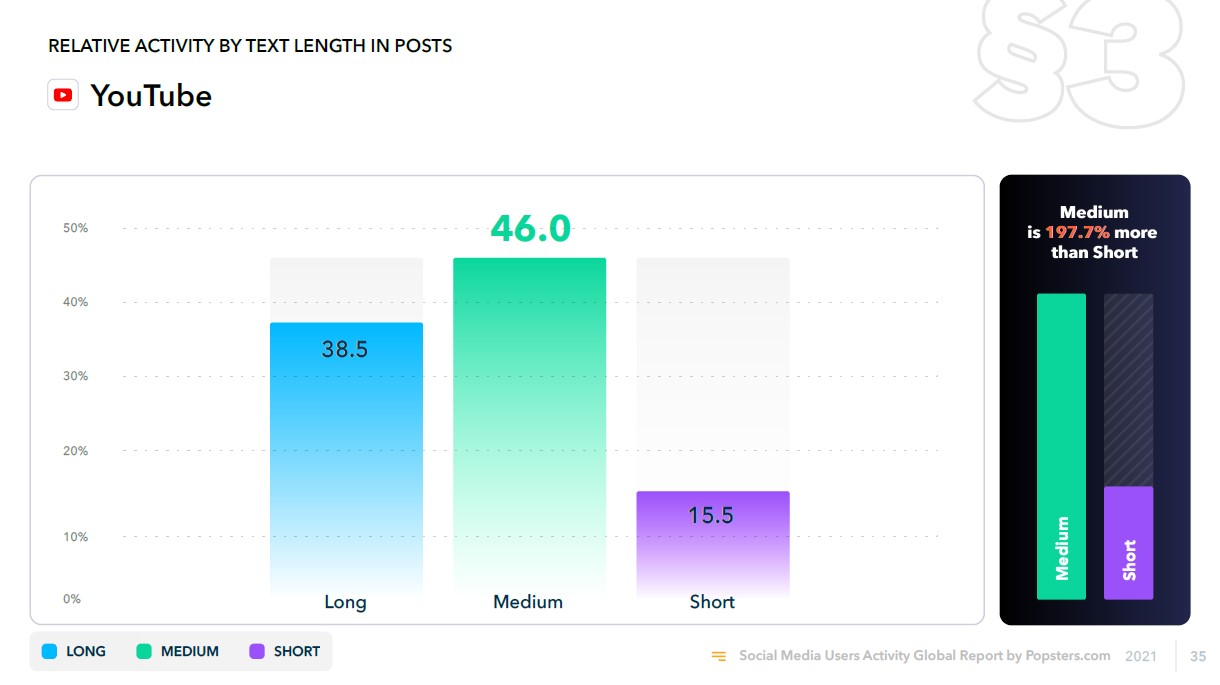
On YouTube, medium and long descriptions are most effective.
The preferences of the OK and VK audiences have not changed, as medium and short text still gain most engagement.
The average indicators are almost unchanged for all the social media, with long texts attracting smaller audience.
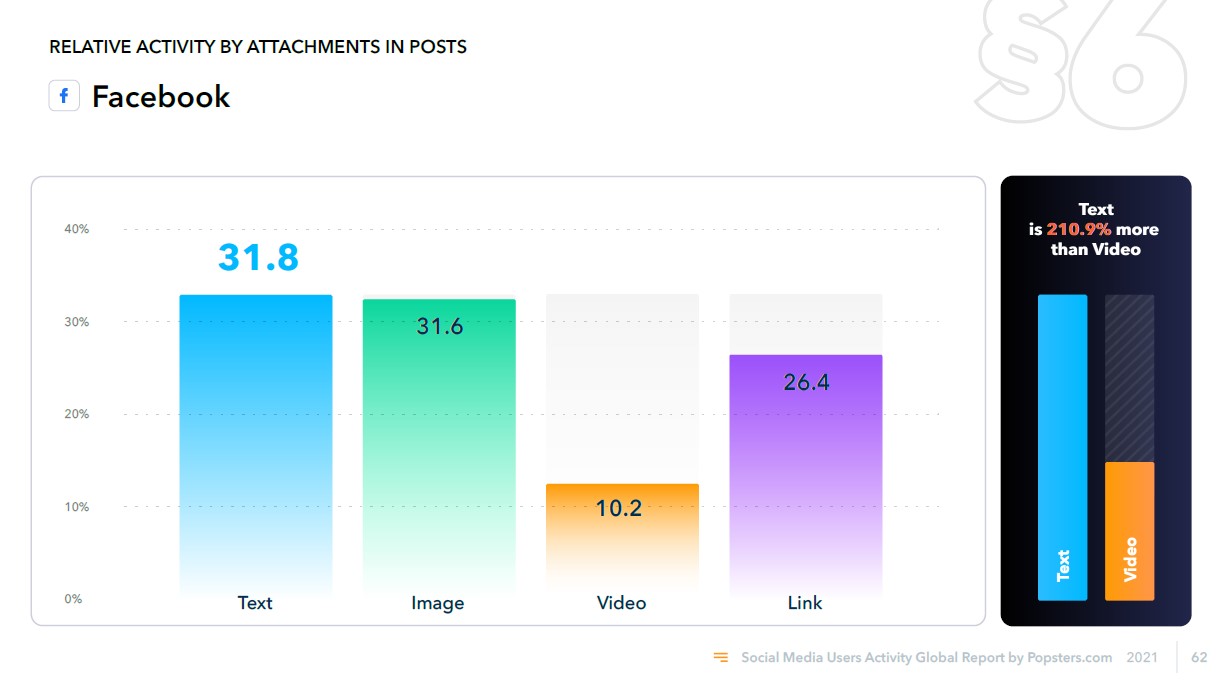
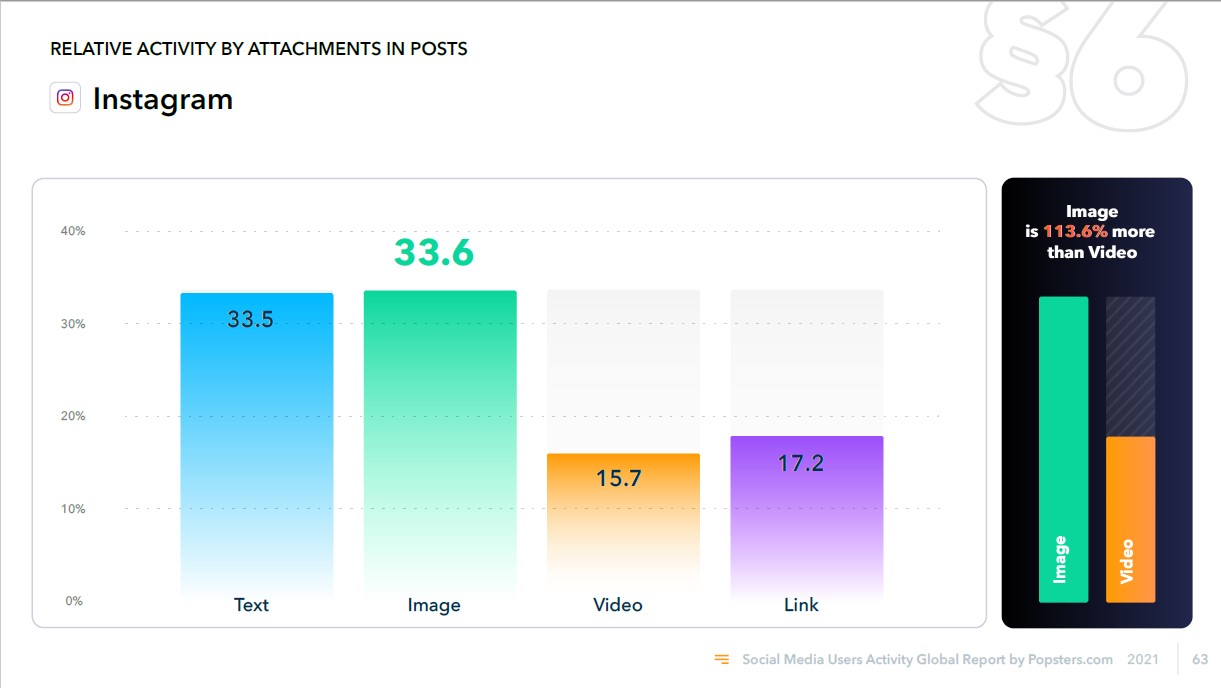
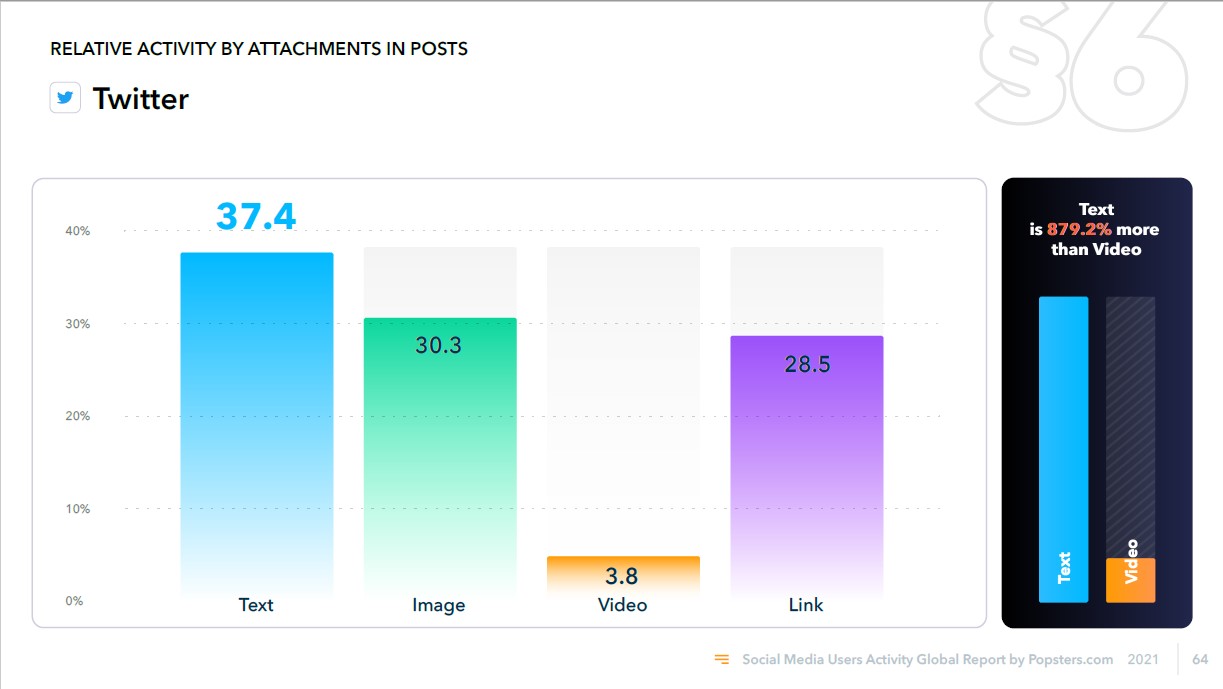
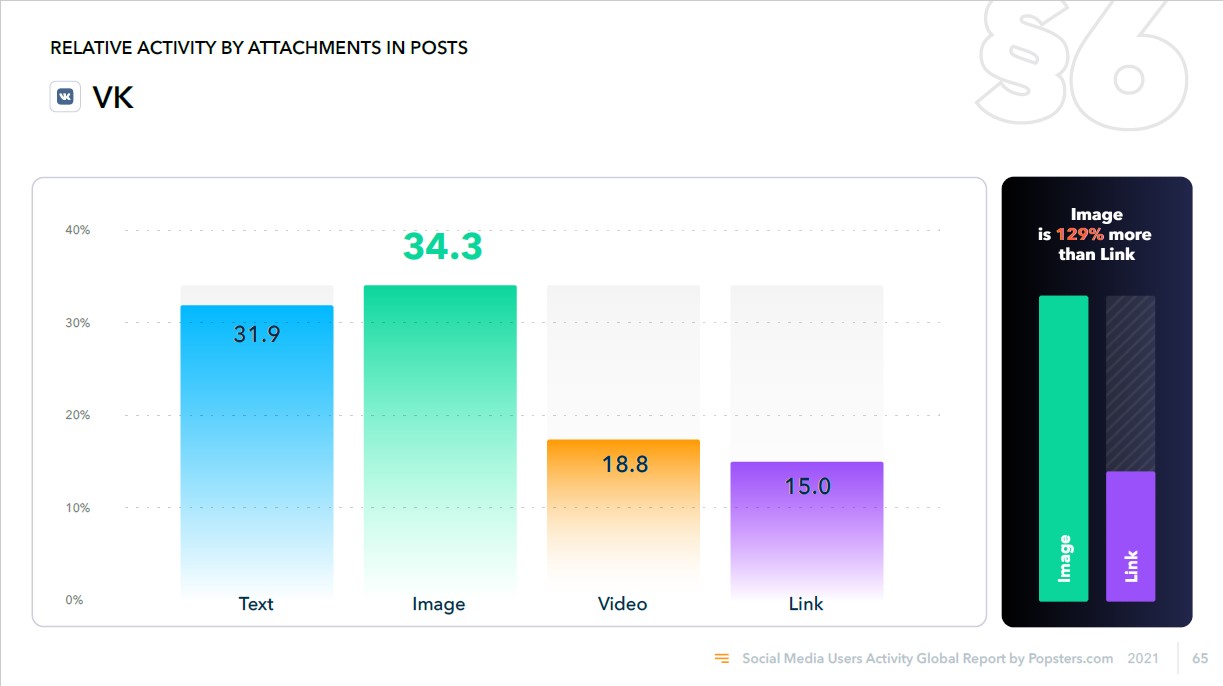
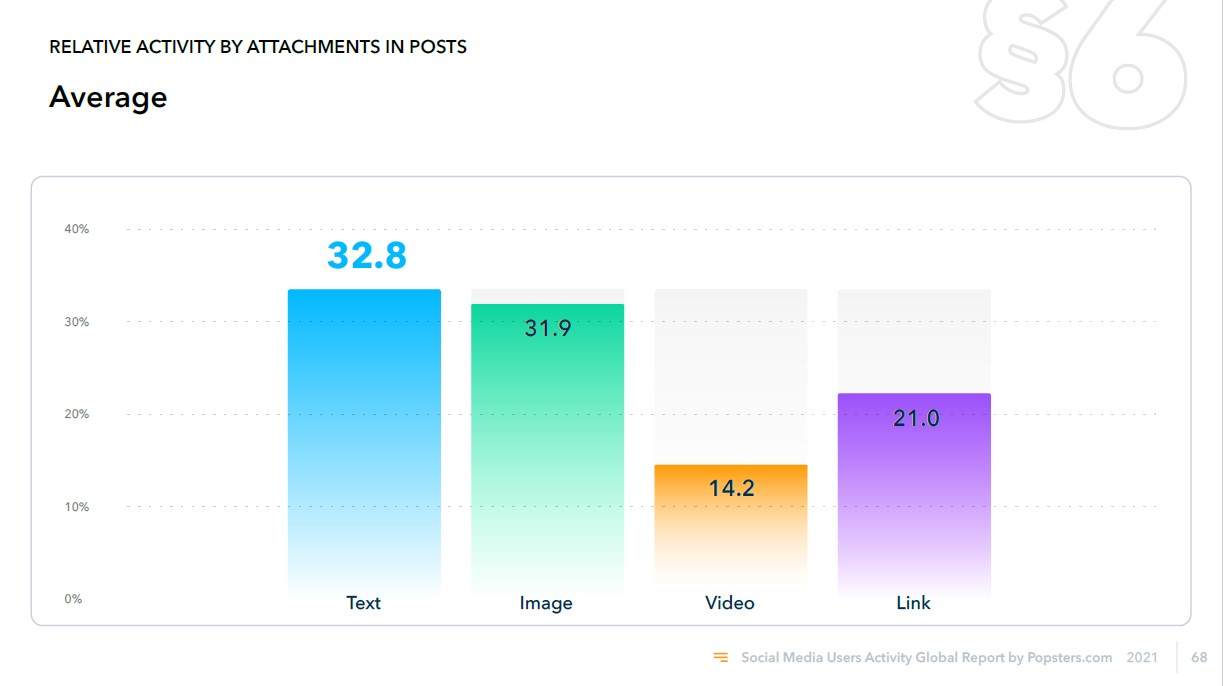
Audience activity by content type
On Facebook, the engagement for posts with videos has dropped even lower, while other formats gain at least twice as much activity.
On Instagram, the activity for posts with links has slightly decreased and video posts are still least popular (Reels and Stories not taken into account).
Tweets with text are leading in activity. Even having a picture, on the average, turns out to be less effective than not having one. Videos are hardly watched.
The activity on VK for posts with videos has increased a bit, while the engagement level for posts with photos has decreased by about the same amount. One may suppose that VK is testing new ranging algorithms to favor videos with advertisement added.
On the average, activity for video has decreased for all social media. Probably, the brisk growth of YouTube, TikTok, Reels and similar formats has affected the interest towards normal posts with videos.
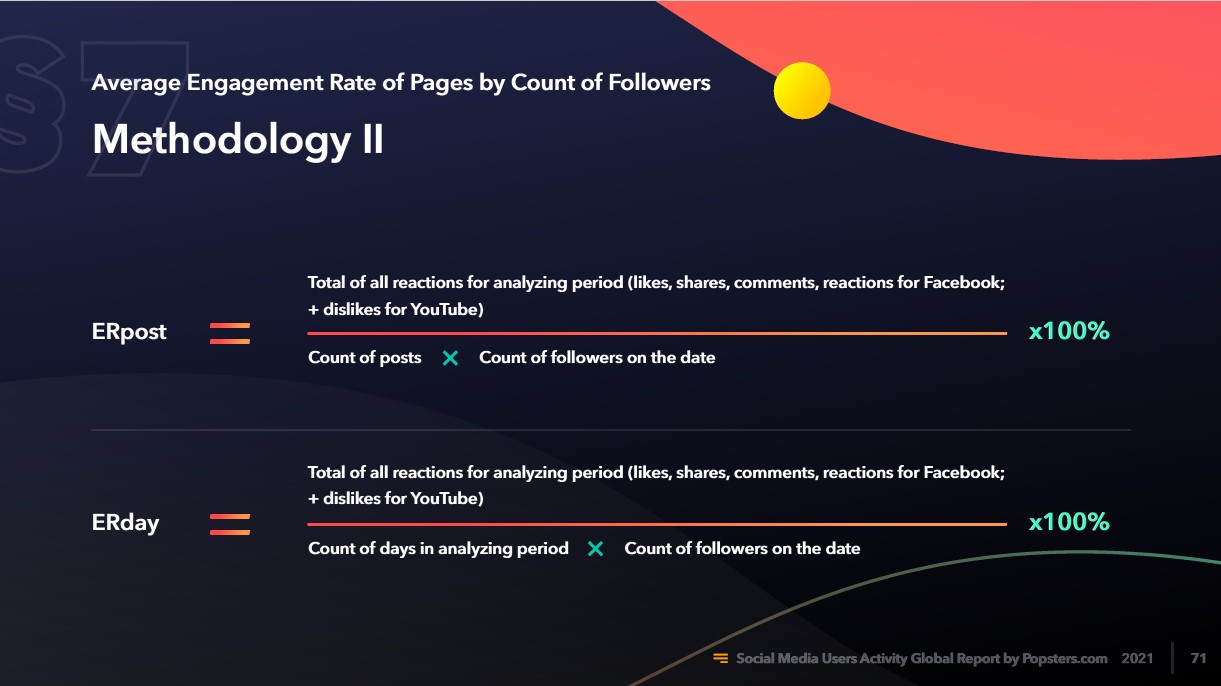
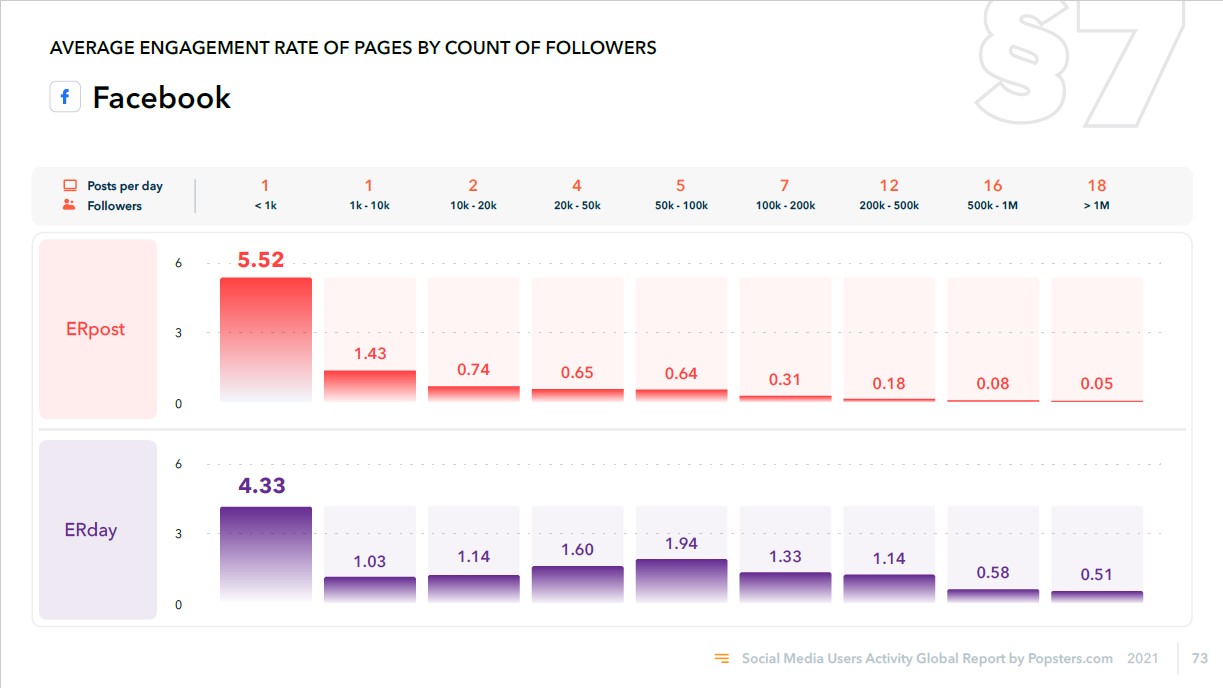
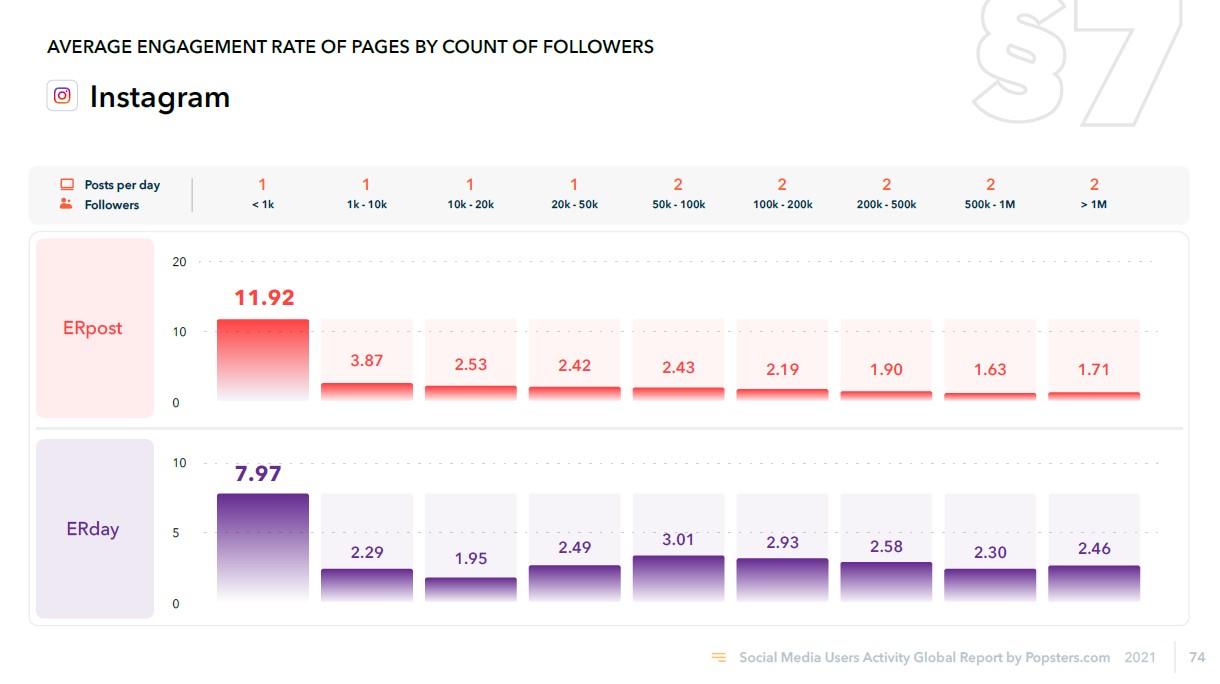
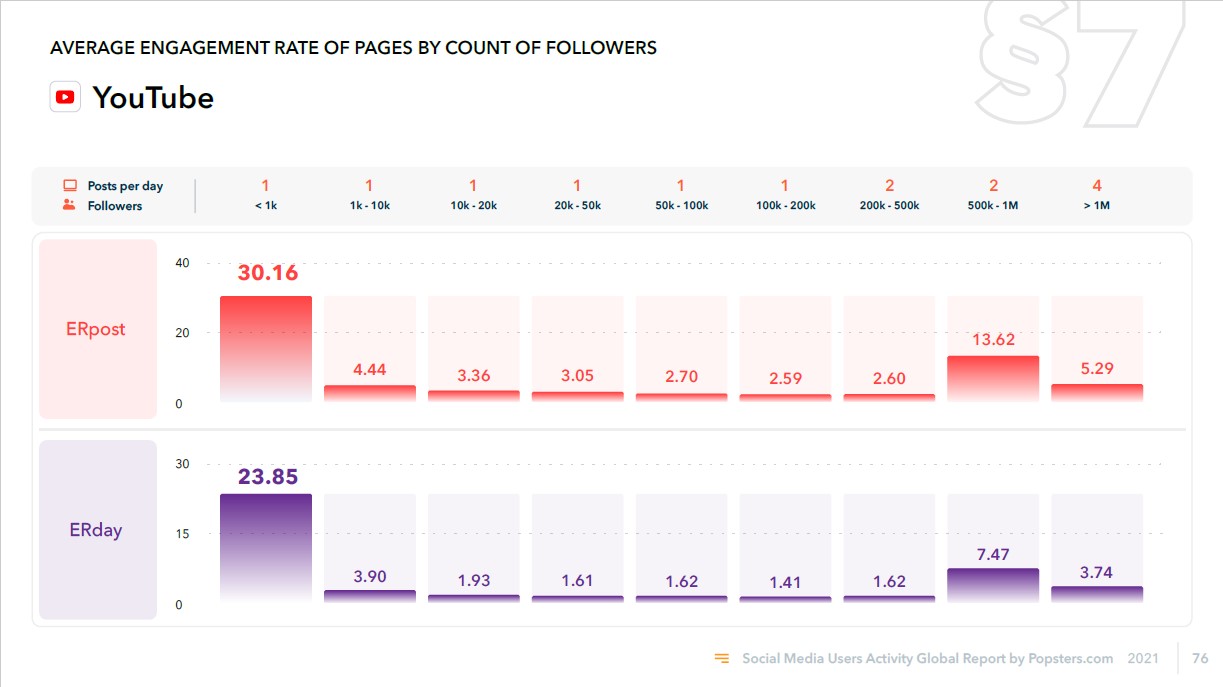
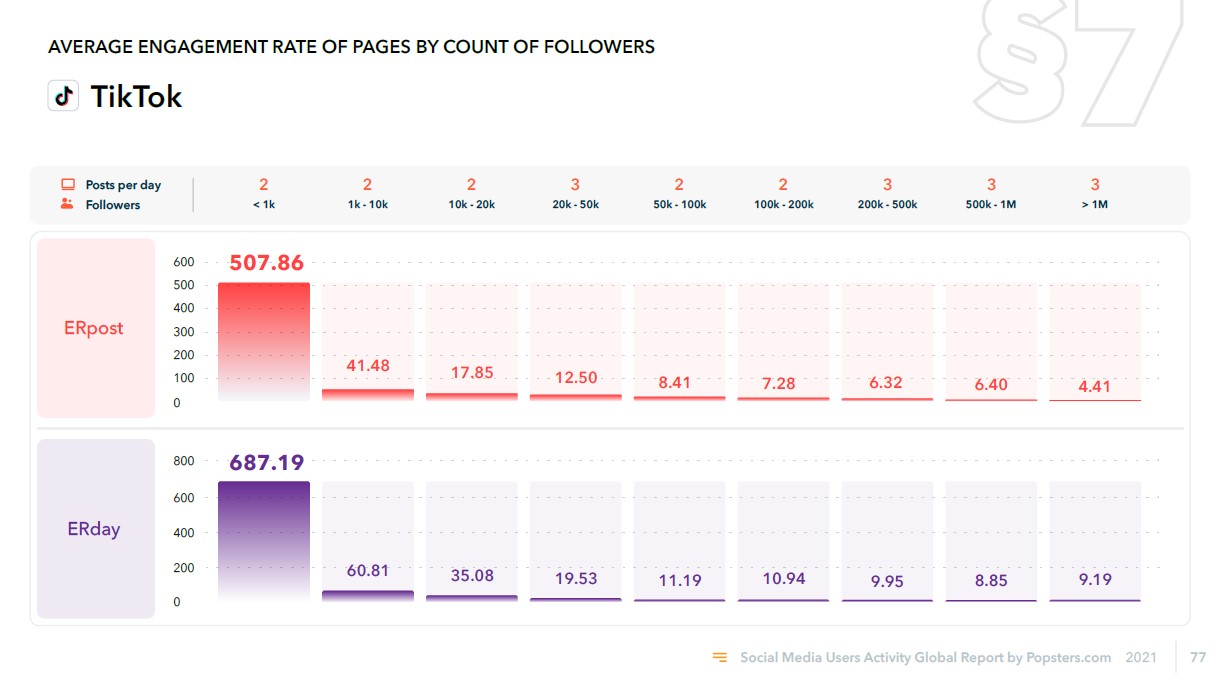
Average engagement rates by audience size
For Facebook, the engagement rate for pages with less than 1000 followers has decreased by times, while there are no noticeable changes for other audience sizes.
There are noticeable changes in engagement on Instagram, where the average numbers have increased for all page types, which may indicate the platform’s active removal of bots.
YouTube, as compared to the previous year, shows significant increase in ER for channels with 500,000 to 1,000,000 subscribers (by 5 times), for millionaire channels it doubled, while there is almost no change for other channels.
The change in numbers is most dramatic for TikTok: the engagement has increased by 5 times for profiles with audiences smaller than 1000, while it has decreased by 20% to 30% for bigger audiences. The TikTok’s average engagement rate statistics demonstrates the platform started to encourage new creators to be active, showing their videos in the feed more frequently.
There are no significant changes observed for OK and VK – the indicators are similar to previous years.

Conclusion
The TikTok's average ER statistics demonstrate the platform started encouraging new creators, showing their videos in the feed more frequently. This has negatively affected indicators of larger and more popular accounts but, at the same time, significantly increased the volume of content on the platform.
We have also found unusual correlations when processing raw statistical data by posting hour:
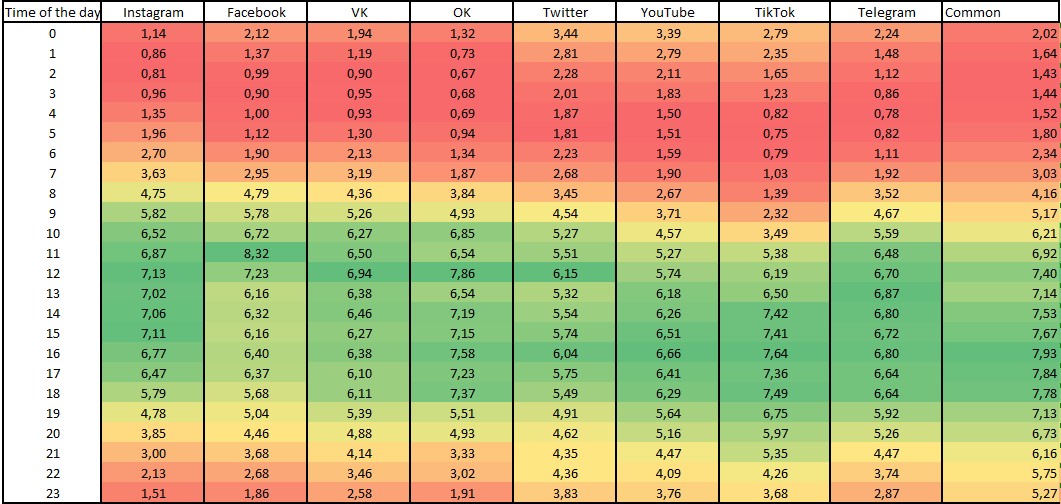
As you can see from the color pattern, 6 social media (VK, OK, Telegram, Instagram, Facebook and Twitter) have almost identical activity by hour, with the difference being ±1 hour, while the highest activity for YouTube and TikTok is later.
One may suppose that YouTube and TikTok have younger audience, which is why the activity peak coincides with the close of classes. In addition, video content is probably not so convenient for watching during business hours, so older audience uses these social media later during the day.
The situation with reduced activity on weekends and during nighttime has not changed for any of the platforms. Apparently, the time of posting still matters and algorithmic feed doesn't affect it that much.
You can review the results in more detail in the full version, compare with previous years and add to your materials or studies. When printing out materials based on these data, please make sure to provide the link to the source.
This material is available under the CC BY license.
Study by: Arthur Kalin, Arseniy Kushnir
Report by: Arseniy Kushnir
Useful article on a similar topic:
- How to Remove fake Followers on Instagram and Is It Necessary?
Try Popsters Trial plan to get content activity statistics of any pages for a next 7 days for free
Try for free
Popular
-
 Instagram Statistics and Analysis: How to View Data of any Account
-
 How to Increase Telegram Subscribers: Best Free Ways
-
 Analytics and Statistics for Any Telegram Channel or Chat
-
 How to Remove fake Followers on Instagram and Is It Necessary?
-
 YouTube Analytics and Statistics for Other Channels
Try Popsters Trial plan to get content activity statistics of any pages for a next 7 days for free
Try Popsters