Free TikTok Analytics and Statistics for Any Account

TikTok grows, and brands and bloggers are testing the new platform. You also must be thinking of launching your personal or brand’s account on TikTok. We are to get you prepared to work with the new platform by discussing the content analytics. We discuss what analytical capabilities are available on TikTok analytics, how to check other profiles’ statistics and what to do with the obtained data.
TikTok’s Internal Statistics
TikTok analytics gives you a full picture of how your content performs. You can track follower growth, engagement rate, reach, watch time, audience demographics, and video completion rate. These insights help you understand what resonates with your audience, identify the best posting times, and refine your content strategy to increase visibility and grow your following faster.
TikTok’s built-in statistics is available to account owners in the app. It can be seen by users who switched the account type to Pro. A bit like the Instagram Business account mechanics – the statistics on TikTok is available to users who have changed the account type.
Switch to TikTok Pro:
1. Enter your profile (the “Me” tab), go to menu (the three-dot icon in the upper right). Select “Settings”
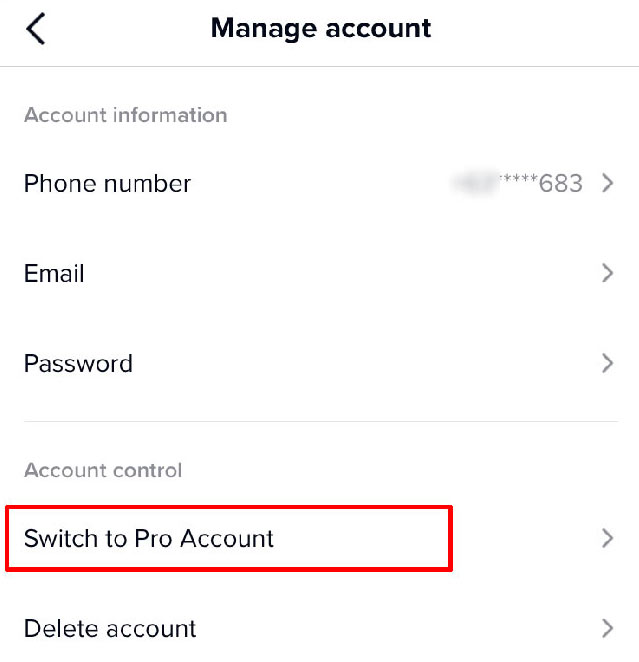
2. Navigate to “Manage my account”
3. Tap on “Switch to Pro Account”
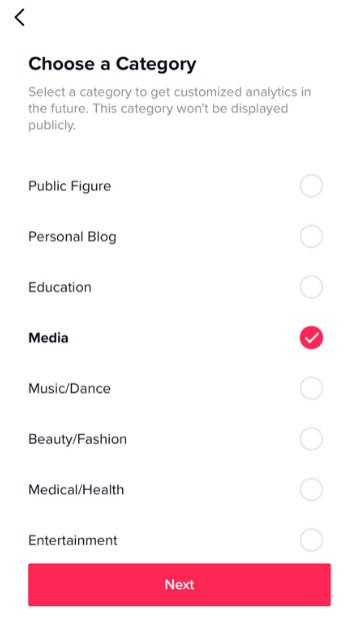
4. Choose a category that suits your account.
5. If you did not tie a phone number before, enter it at this stage, as well as the code that you will receive by SMS.
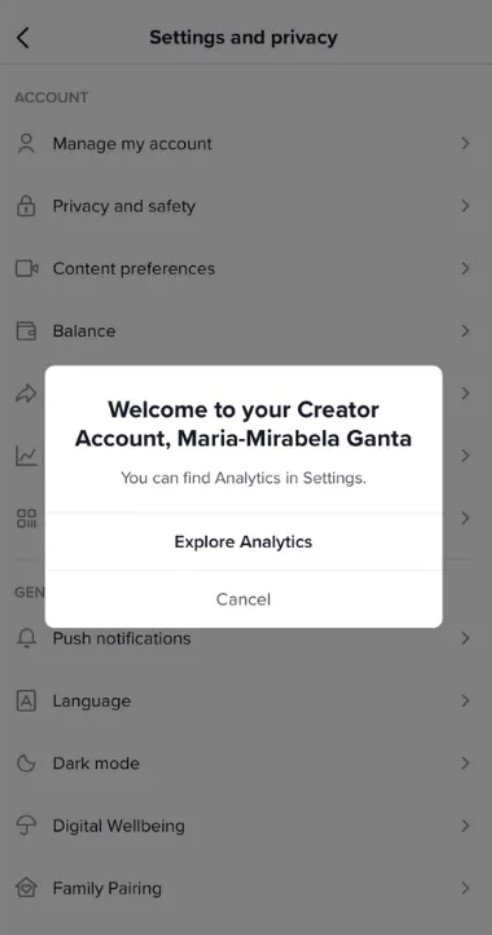
6. Done! You will see the “Welcome to Pro Account” box.
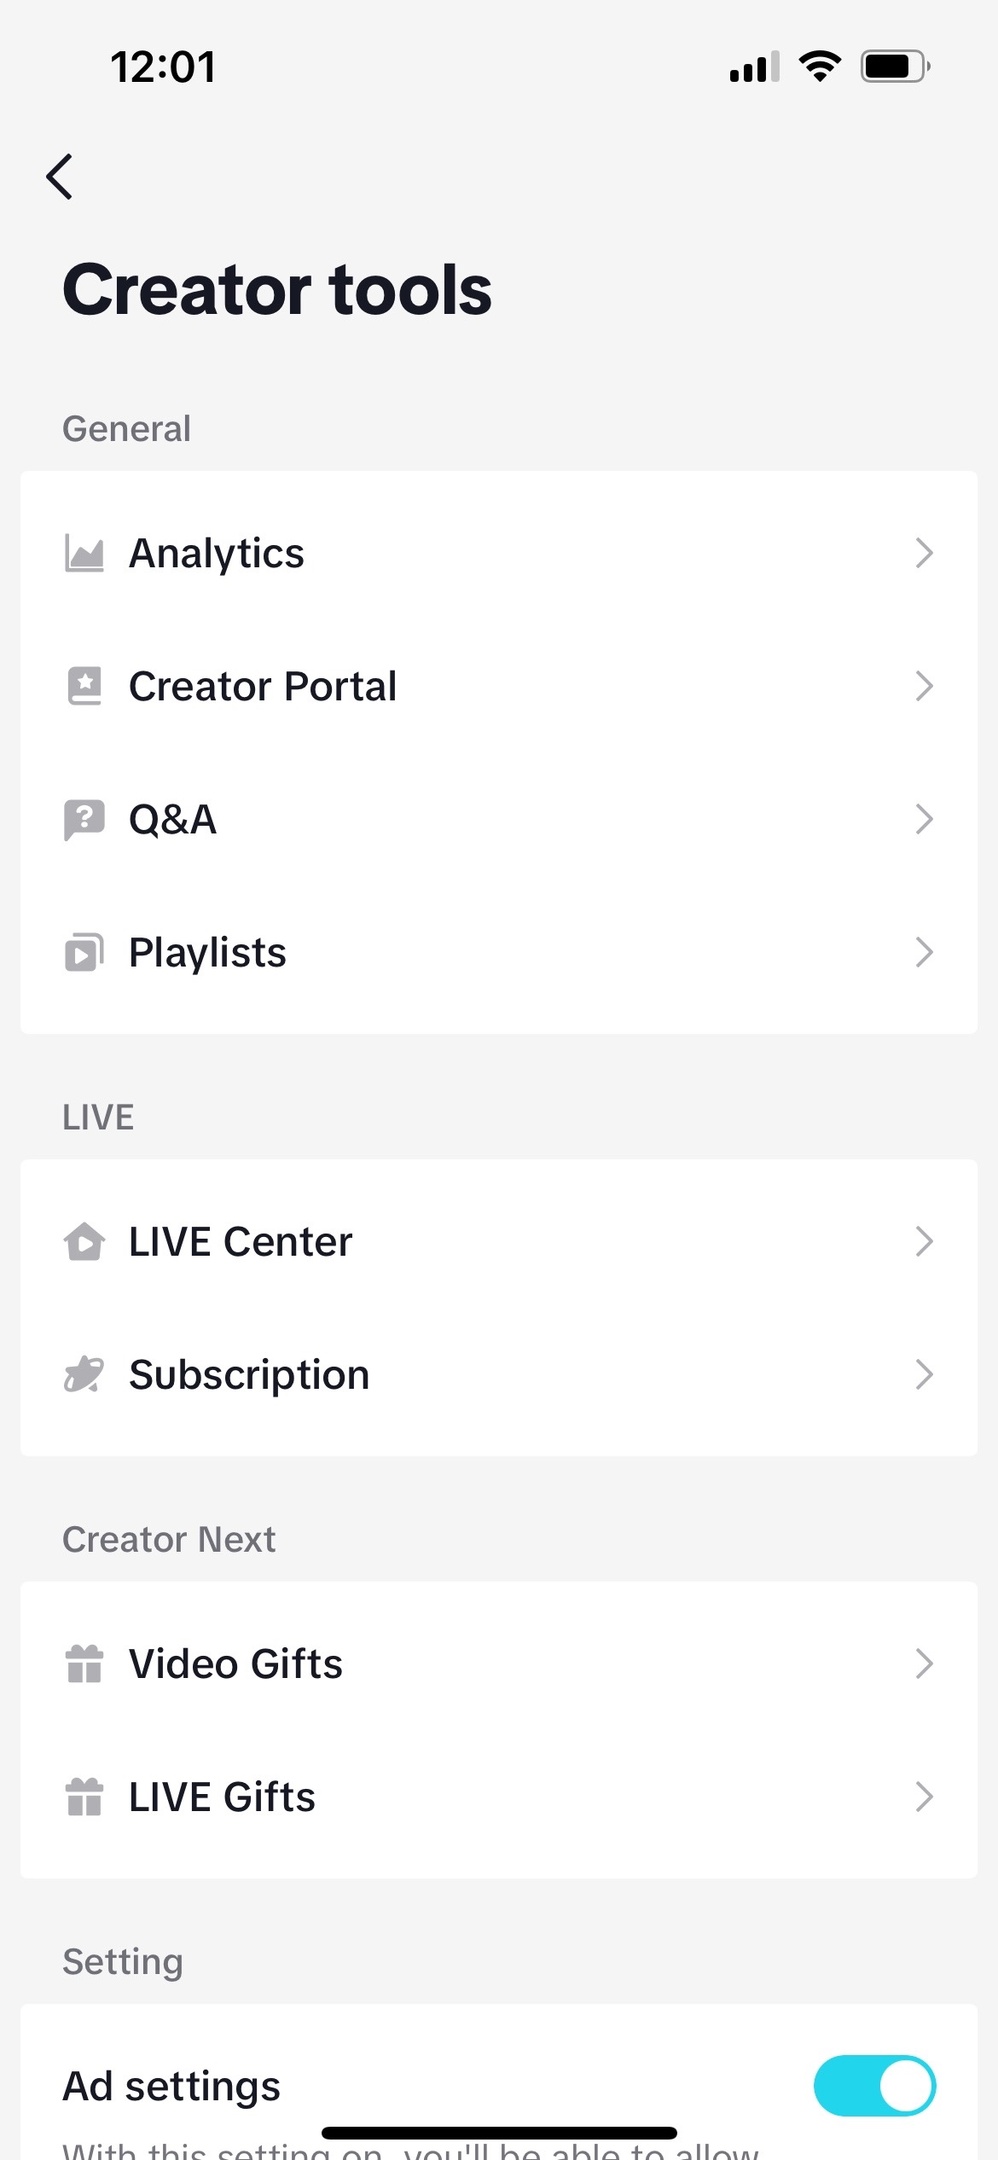
Now go to the profile, click on the three bars in the upper right corner, then "Creator Tools" and "Analytics.
It starts collecting data only after the account type is changed. To analyze the TikTok account’s statistics, wait for the data to accrue. Since the results are evaluated over time, it may take up to 7 days of waiting to obtain TikTok account analytical data that can be used to draw some conclusions.
Capabilities of the Free TikTok Analytics
The TikTok’s built-in statistics is divided into three large sections:
1. Overview;
2. Content;
3. Followers.
Switch between the tabs to review indicators from different sections in more detail.
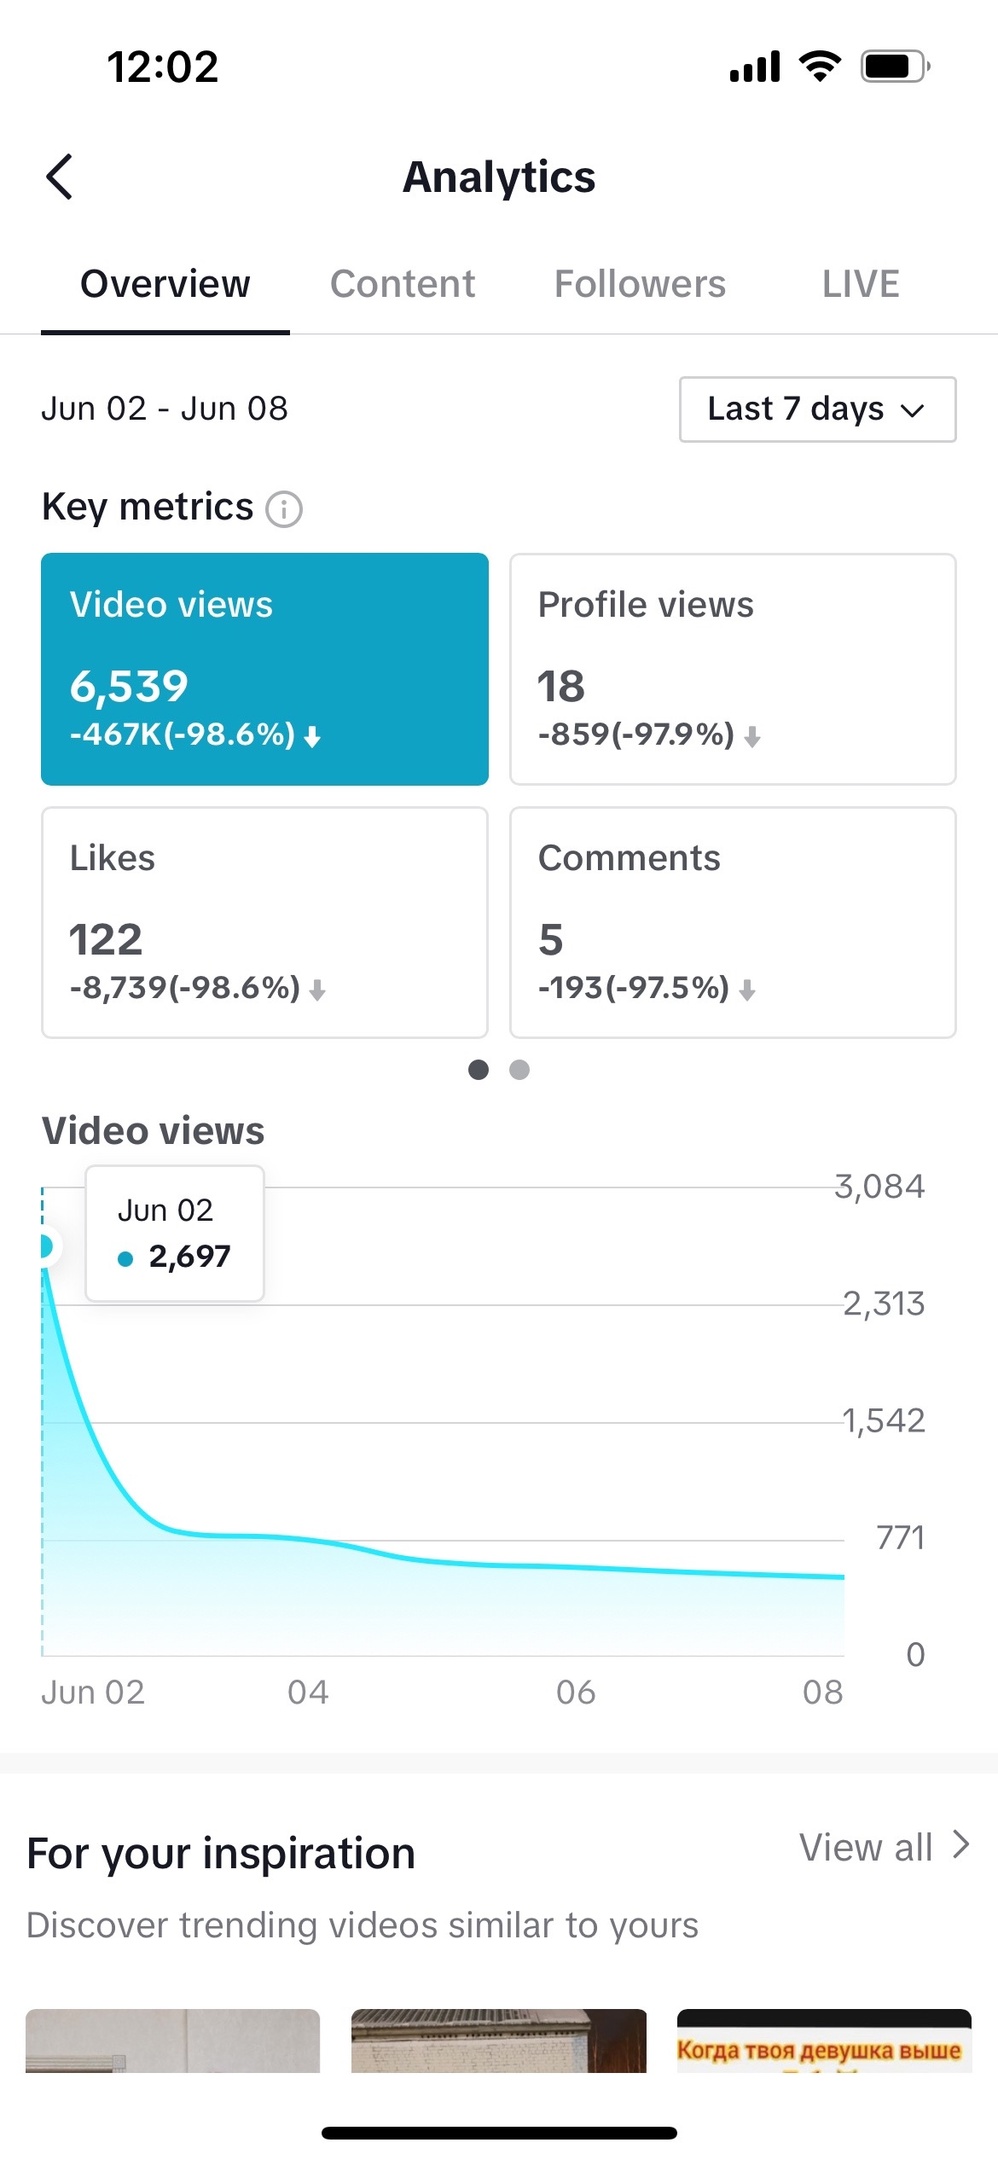
Overview
It shows TikTok account analytics basic information:
- The total views of all videos in the account;
- The number of followers and the graph with the dynamics of their growth;
- Number of profile views and graph for the selected period;
- The number of likes and comments;
- Videos for inspiration.
All indicators in the built-in analytics of TikTok are evaluated in sections: 7 days, 28 days, 60 days and any selected period.
Content
The Content section of TikTok analytics is where the account’s videos are analyzed in detail. It has two subsections:
- Video posts: latest videos posted, from old to new ones, over the last 7 days.
- Trending videos: as opposed to the previous subsection, this shows 9 videos that received the most views over the last 7 days.
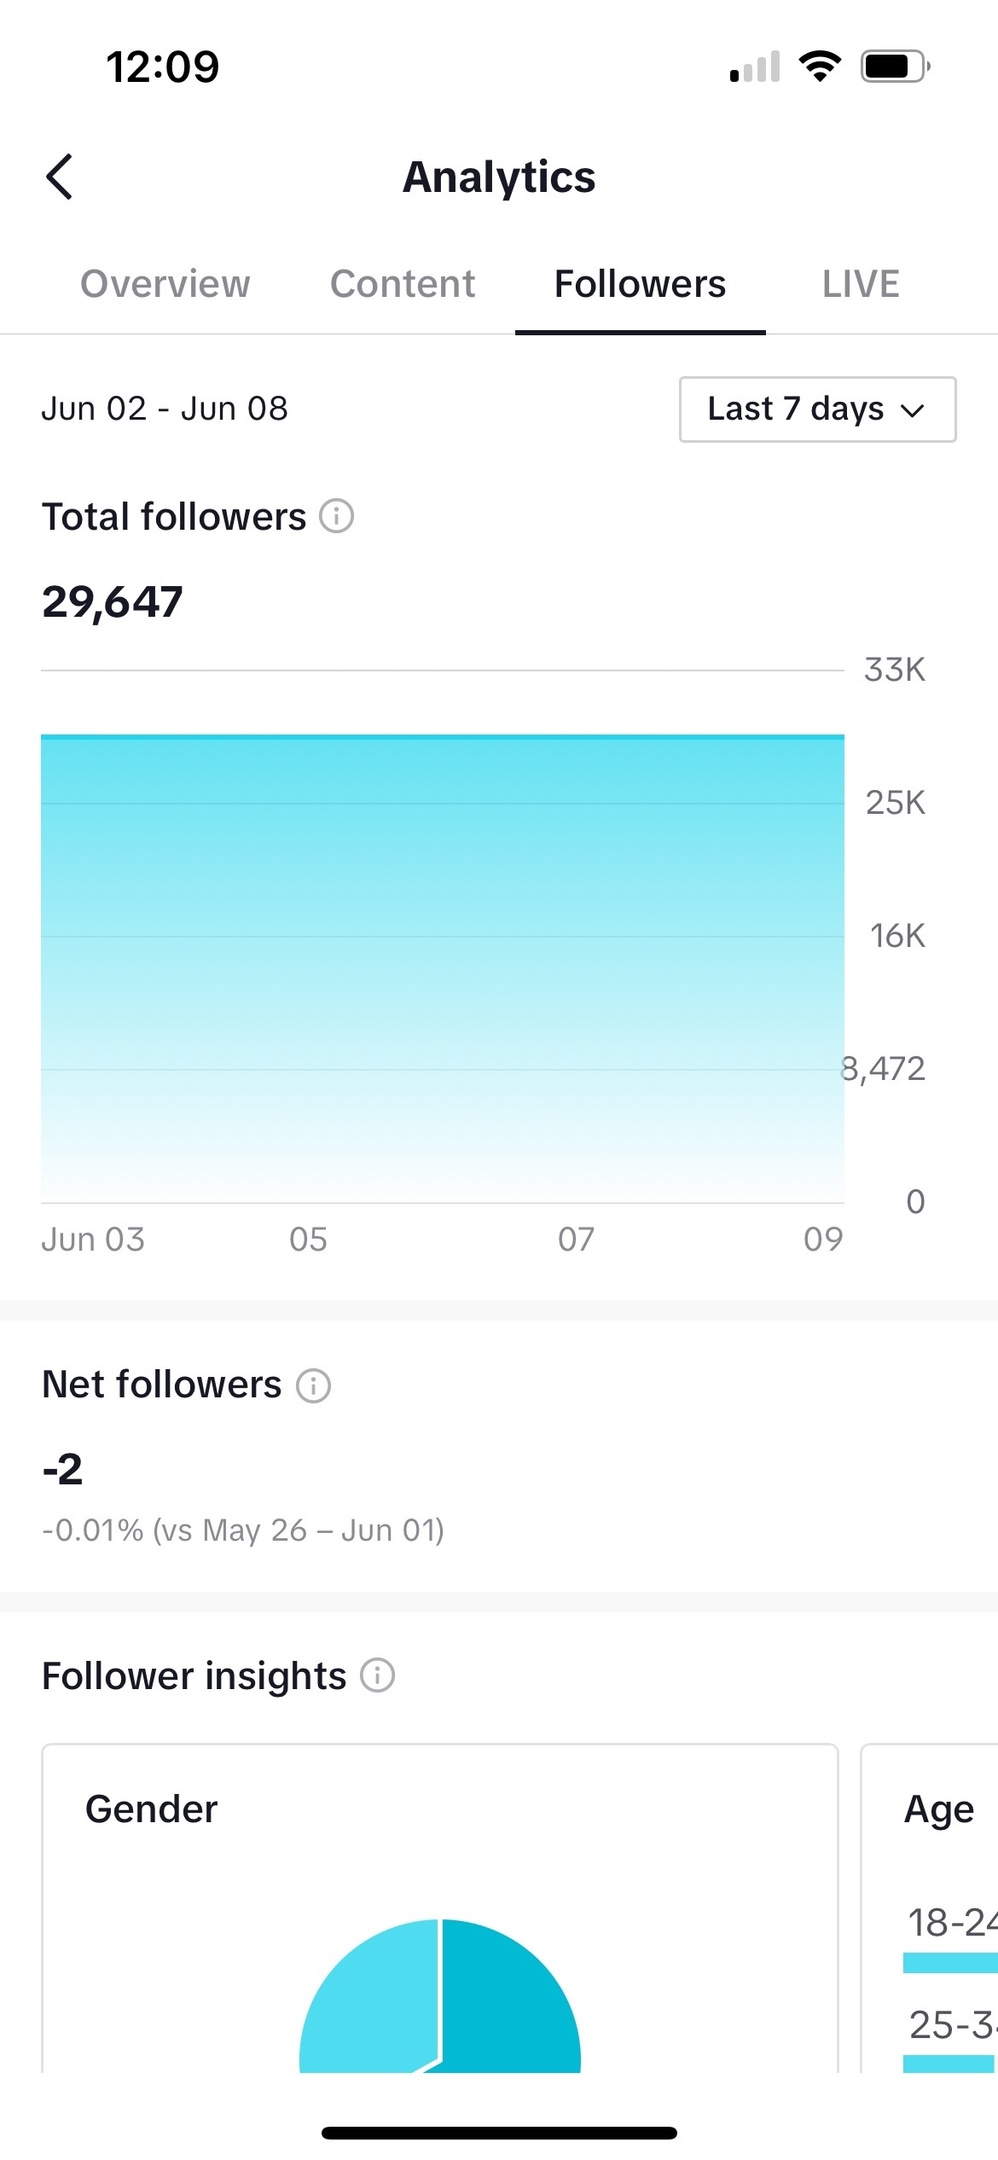
Followers
Detailed information of TikTok accounts statistics that following you: follower count, audience distribution by gender/location. This section also includes diagrams of hours when the followers are most active.
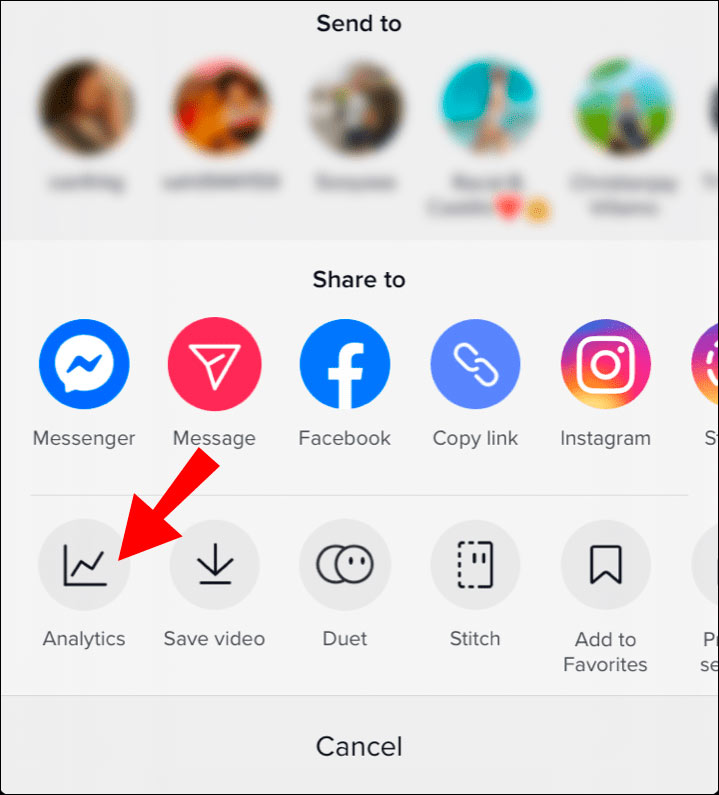
You can quickly navigate to the statistics for any video by opening it, then tapping menu (three dots) and selecting TikTok Analytics.
How to Analyze Others’ TikTok Profiles
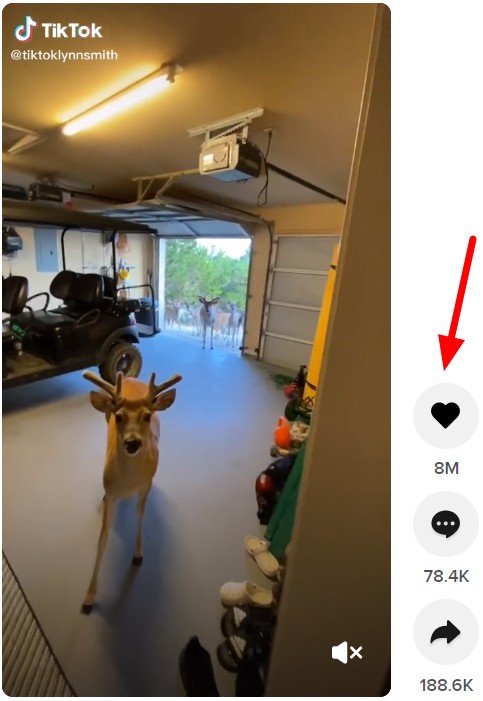
Little data is available for other users’ profiles. Any user can see the followers count, the subscriptions count and the total count of likes received by all posts. In a user’s account, anyone can see the views count for any of the account’s videos.
Some data of TikTok analytics for individual videos is also available: likes, comments, shares.
The statistics is only available to the account owner. Surely you were interested in how to view TikTok analytics for oher accounts. So you would need to use third-party TikTok analytics tool to analyze competitor profiles.
You can compare several accounts, find the most popular content, identify hashtags and categories, plot diagrams of competitor’s audience engagement using Popsters. It has much more enhanced analytics than the Instagram’s built-in statistics, therefore Popsters is suitable for a more in-depth analysis of your own account.
The tool currently works with TikTok completely free of charge.
How to Analyze TikTok Accounts in Popsters
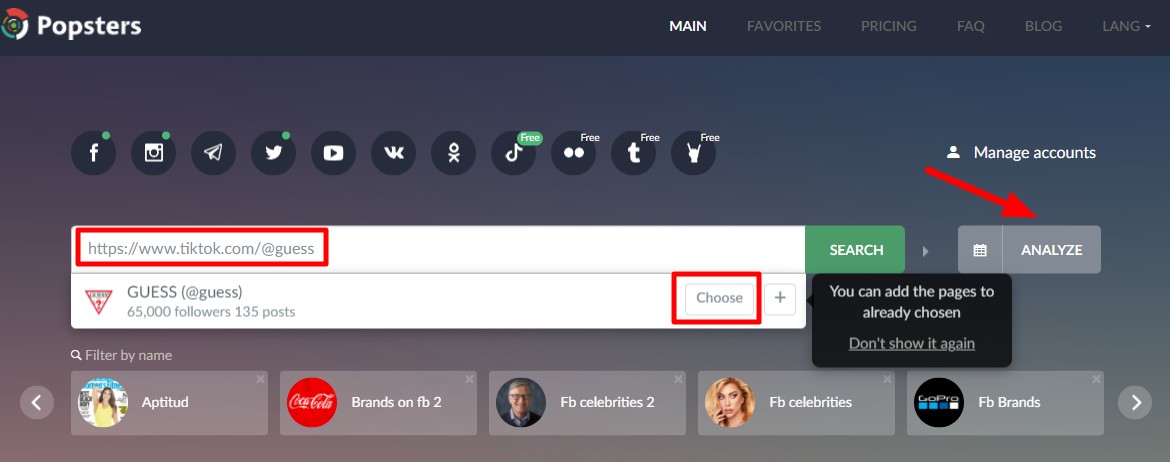
Paste into the search box the full link to the competitor account that you want to get statistics for. Click Search and select the account of interest with the Select button in the list.
Now, define the analyzed period and click Load.
You will see the feed of posts by the selected account. By default, it is sorted by the like count: above is the post that received the highest number of likes. Sort the feed by any criterion: Likes, Shares, Comments, ER or chronologically, by date of posting.
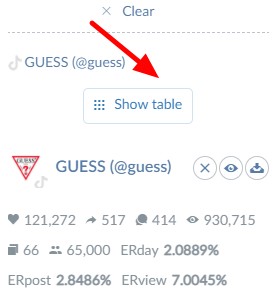
The right column shows TikTok analytics for other users accounts general information for the analyzed period: total count of likes, shares, comments, as well as of posts and followers. To get this data in an expanded form suitable for use in reports or presentations, click Show Table.
You can download this TikTok analytics data in xlsx format. If you have chosen several accounts at the first step, then you can compare them in this section by basic engagement indicators. The table of comparison can also be downloaded and used in a report.
In the left column you can choose more details of the TikTok analytics for other users
account’s content efficiency:
- Engagement by day of the week;
- Engagement by hour;
- Diagrams of likes, comments and shares by date.
Efficiency diagrams for posts with different hashtags are of particular significance for TikTok analytics:
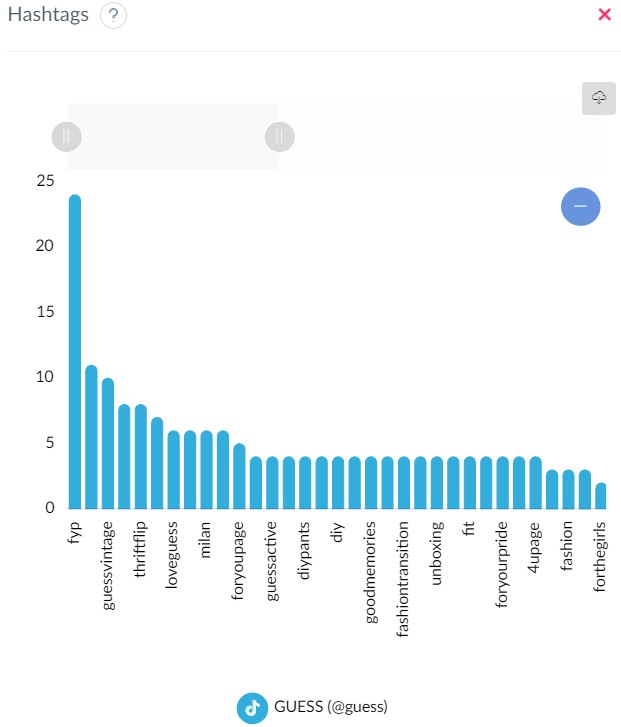
- Count of posts with different hashtags;
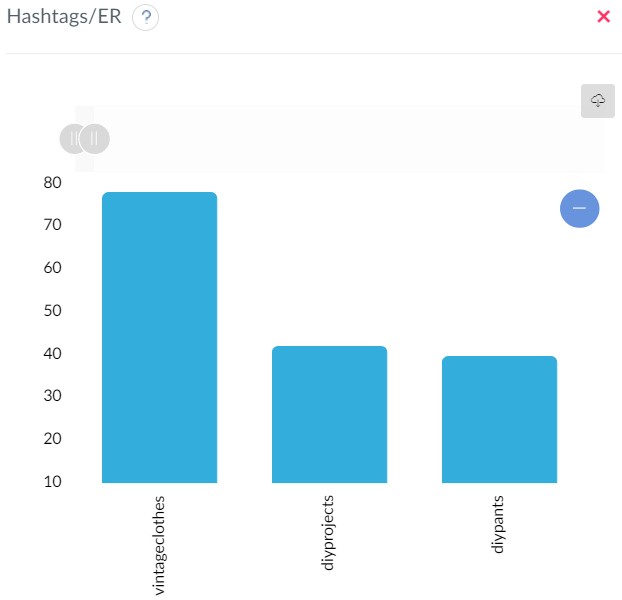
- Average ER for posts containing a certain hashtag;
- Average efficiency of posts with a hashtag as compared to posts with another hashtag.
Any data can be exported in any suitable format: as an image, or in csv, xlsx, json, html.
TikTok Hashtag Analytics
Analyze which hashtags influence the efficiency of posts on TikTok. These 3 reports will help you:
Hashtags: Shows the number of posts published for every hashtag
Hashtags/ER: Shows the average ER of all posts for every hashtag over the selected period
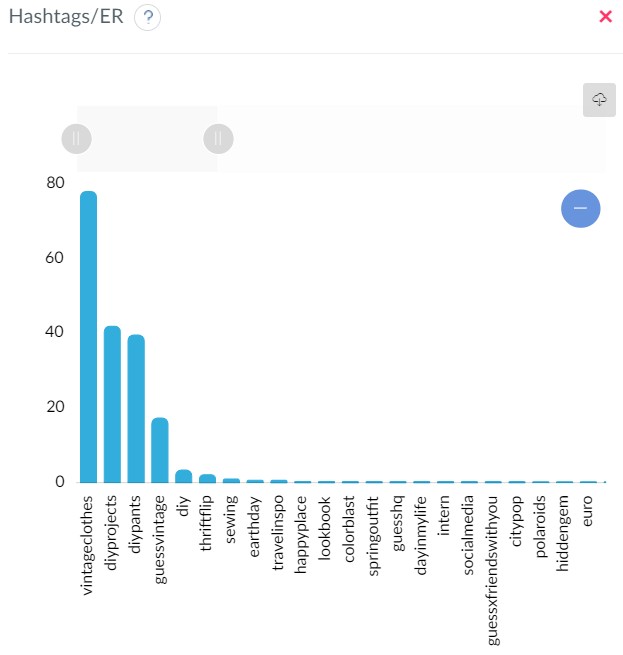
Relative activity by hashtag: Average efficiency for posts with a particular hashtag, as compared to posts with other hashtags.
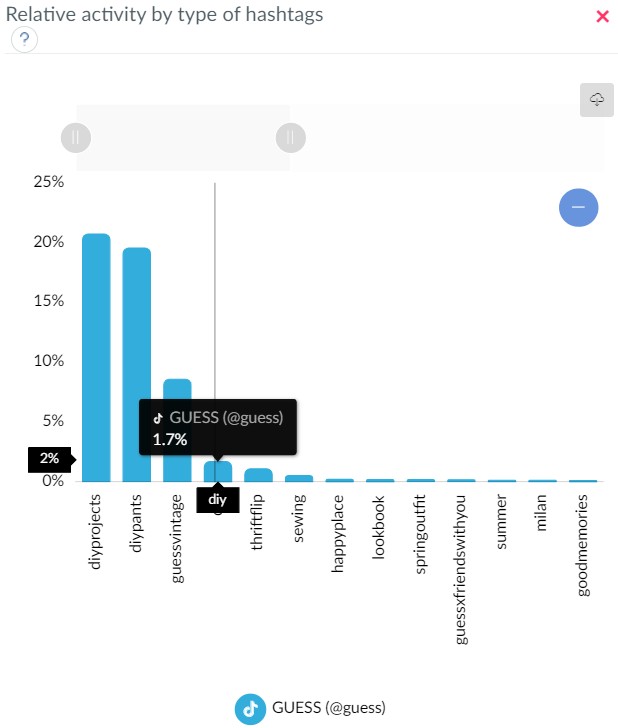
These reports of TikTok account analytics will help to evaluate which hashtags are most frequently used by your or your competitor’s account. And also see the efficiency of posts with different hashtags and choose hashtag to use in your future work.
How to improve the analytics performance of a TikTok account
Here are some tips to improve your TikTok account analytics performance:
-
Create compelling content: Start by creating high-quality, interesting, and unique content. Be creative and experiment with different formats, trends, and musical backgrounds. Try to offer something special and different from other videos.
-
Use hashtags: Hashtags play an important role in content discovery on TikTok. Use popular hashtags based on TikTok analytics data related to your video to increase its visibility. You can also create your own unique hashtag to maintain a connection between your videos and your account.
-
Collaborate with other content creators: Consider collaborating with other popular content creators on TikTok. This can help you attract a new audience and increase the number of followers. Create joint videos, participate in challenges, and mutually recommend each other.
-
Engage with your audience: Strive to create content that will interest and engage your audience. Ask questions, provoke comments, conduct polls, and be sure to respond to comments and messages to maintain active interaction.
-
Post regularly: Regularly updating your account will help you retain attention and interest from your audience. Try to create and publish new content regularly to maintain the activity of your account.
-
Analyze your statistics: Use the built-in analytics tools on TikTok to get an understanding of your account's metrics. Analyze views, comments, likes, and followers to identify successful videos and content, as well as to understand your audience's preferences.
-
Follow trends and challenges: Stay updated on current trends and challenges on TikTok and try to incorporate them into your videos. Participating in trends can help you gain more attention and attract new followers.
-
Promote your account: Consider using TikTok's advertising tools to promote your account. You can set up advertising campaigns to increase the visibility of your content and attract a new audience.
Finding the TikTok’s Best Hashtags for Your Videos
Hashtags help to promote content on TikTok: new viewers may find your posts by them. But not all hashtags would be good for that. Hashtags are primarily divided into more frequent and less frequent.
Enter a hashtag in the TikTok search to evaluate its frequency. More than 500 thousand search results means high frequency and less means low frequency.
The competition in high-frequency hashtags is high, meaning low chances for your video to be discovered when whatching videos by the hashtag. But you can also add them to the video description. You can find such hashtags on the Discover tab where TikTok shows all the trends, including the currently trending hashtags.
Low-frequency hashtags are used less, so they increase the chances to receive organic views. You need to pick such hashtags manually or using specialized TikTok analytics tool (or which have support for this Social network). For example, analyze similar accounts in Popsters as described above. Thus you will get a list of hashtags used by them.
How to Use Statistics for TikTok
Having gathered the TikTok analytics figures, you can conduct competitor analysis or develop a strategy for your account.
The TikTok account statistics will help to evaluate the efficiency of account keeping: you will see how the account popularity evolves and whether it is better or worse as compared to other profiles in the category.
Competitor Analysis
Collect the following data to analyze your TikTok competitors:
- Follower count;
- Like count;
- Average view count per video;
- Video posting frequency;
- Audience engagement rate (ER);
- Subjects of videos.
Strategy Development
Before developing the idea for your TikTok profile and creating the content strategy, assess your competitors and foreign accounts in similar subjects.
- Average ER per account;
- Video with the highest ER: subject, presentation, music, duration;
- Video with the lowest ER.
Suppose why these videos became popular or failed. Come up with a similar subject and include it in your content plan.
Analyzing a TikTok blogger account analytics before placing Ads
Set up a separate file (better in Excel or Google Sheets) where you will regularly track indicators:
- Follower count;
- Like count;
- Count of videos posted over a period;
- ER.
Fill in this file once a week or at least a month. You will be able to track the audience and engagement growth and notice when the growth slows down and the account performs worse. Analyze why that happens. Compare with competitors to see if they experienced a similar drop in performance or the problem is only with your account.
Useful article on a similar topic:
- How to Become TikTok Popular in Few Easy steps.
Try Popsters Trial plan to get content activity statistics of any pages for a next 7 days for free
Try for free
Popular
-
 How to Increase Telegram Subscribers: Best Free Ways
-
 Instagram Statistics and Analysis: How to View Data of any Account
-
 Analytics and Statistics for Any Telegram Channel or Chat
-
 How to Remove fake Followers on Instagram and Is It Necessary?
-
 YouTube Analytics and Statistics for Other Channels
Try Popsters Trial plan to get content activity statistics of any pages for a next 7 days for free
Try Popsters