YouTube Studio Metrics: Ways to Get Advanced Data
YouTube Studio has a handy built-in tool - YouTube Analytics, that allows you to analyze the performance of your videos and channel, work with statistics, graphs, and reports.
Today, much people practice promotion through YouTube channels. The main advantage is a huge reach, which makes it possible to declare yourself, your product or service to a large audience. With the right approach and choice of development strategy, you can achieve great results.
Ways to get analytics data
There are two convenient ways to see account statistics:
- The built-in YouTube Creative Studio tool (your account);
- Using the social media page analytics tool Popsters (your own and any other pages).
Let's start in order.
YouTube Creator Studio Analytics
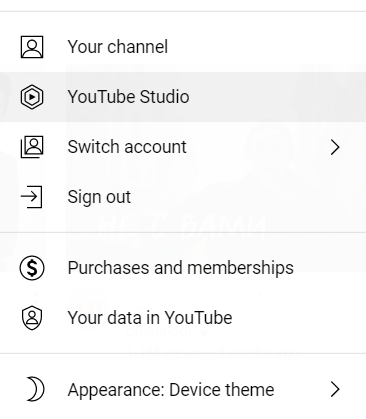
1. Click on your profile in the top right corner.
2. Select the “YouTube Studio” tab.
3. You will immediately see the performance of the latest video. On the left, click on the "Analytics" tab.


At the top of YouTube Studio you will see 4 tabs:
- Overview;
- Conten;
- Audience;
- Research.

Overview
The Overview tab provides key performance of YouTube metrics for the channel and individual videos. The Key Metrics card shows the views, watch time, subscribers, and estimated revenue (If you’re in the YouTube Partner Program).
In addition, on this tab you will find the following reports:
• Usual indicators on the channel. The data of the entire channel or a single video.
• The most popular content for the period. Most viewed video in the last 28 days.
• Current statistics. Channel performance for the last hour or 48 hours.
• Plots. The effectiveness of stories for the last 7 days.
By clicking the “Advanced mode” button, you will see detailed general statistics by YouTube metrics with specifics: traffic sources, cities, viewer age, etc.

At the top right there will also be a "Compare" button, where a comparison is available for periods, years and the first 24 hours.
Content
The Content tab collects information about how viewers search for your content, interact with it, and what they watch.
You can also view the following information in the All, Videos, Shorts, Broadcasts, and Posts tabs:
• Views. Views of regular videos, broadcasts and Shorts.
• Icon impressions and video watch time. Number of times users saw the video icon on YouTube ("Impressions") and how many times they started watching ("CTR") + total time spent watching.
• How viewers find your content, including video, shorts and broadcasts. Information about the number of users acquired through Content Choice, Short Videos feed, Featured Videos, YouTube Search, Channel Pages, External, Unknown, and other sources.
• Card with the main indicators. Badge impression video views, CTR and average view duration, number of subscribers, likes and links sent.
• Key audience retention data. Which fragments of your videos are the most popular and keep the attention of the viewers.
• Best Videos/Shorts/Records. The most popular videos.
• Remixes. The number of remixes of your videos and their views, as well as the most popular remixes.
• Recording displays. How many times viewers have seen your post.
Pay attention to the following funnel, it will be useful for improving the quality of content and CTR:

Audience
Also on this tab you will find the following reports:
• Subscriber notifications. What proportion of subscribers have turned on all notifications about your channel and how many actually receive them.
• Watch time by subscribers. Distribution of viewing time on your channel between subscribers and other users.
• Age and gender. Demographics of your audience logged into your account.
• Other channels your viewers are watching. Competitive YouTube channels your audience is watching.
• Other videos that your viewers are interested in. Competitive YouTube videos your audience is watching.
• Most popular regions. Countries where your viewers live by IP address.
• Most popular subtitle languages. Subtitle languages that include most often.
Research
In addition, on this tab you will find the following reports:
• Requests from your viewers. What search queries have been made by your subscribers and viewers of channels with similar content on YouTube in the last 28 days.
How to view YouTube channel statistics from competitors
Also, YouTube Studio gives access only to the statistics of your channel. To view detailed statistics of a competitor's channel, you need to use third-party programs. This is where Popsters comes to your rescue.
First you need to log in to the tool using your YouTube account. Insert the name of the channel or link in the search, select the period of time you want to study and "Download".
You will have access to a large number of statistics and specific numbers, sorted by likes, comments, views, ER, ERView, VR, date.

Pay attention to the general statistics for the selected period on the right side.

Unlike standard YouTube Studio data, here you can see likes, comments, views and other average values not only for the period proposed by YouTube, but for any period, including past years.
With Popsters you can download a report in Excel, PPTX and PDF formats.


Thanks to the analysis of interaction with content (via YouTube analysis tool), you can determine the best time and day of the week for posting and see the changes in indicators of YouTube metrics depending on the strategy that you have chosen for specific videos and content in general.
Useful articles on a similar topic:
- How to see YouTube channel analytics: of any;
- How to trend on YouTube: step by step;
- A convenient, free way to see audience activity on YouTube based on content.
Try Popsters Trial plan to get content activity statistics of any pages for a next 7 days for free
Try for free
Popular
-
 Analytics and Statistics for Any Telegram Channel or Chat
-
 Instagram Statistics and Analysis: How to View Data of any Account
-
 How to Increase Telegram Subscribers: Best Free Ways
-
 YouTube Analytics and Statistics for Other Channels
-
 How to Remove fake Followers on Instagram and Is It Necessary?
Try Popsters Trial plan to get content activity statistics of any pages for a next 7 days for free
Try Popsters