Content audit in 2026: A step-by-step content analysis

You can publish content regularly across different social networks and still have no idea what your audience is actually interested in. Even a content plan filled a month ahead does not guarantee the results you need. You have to analyze your content and draw conclusions about why some posts get a lot of activity while others go almost unnoticed.
A content audit helps you figure this out: it gives you a complete picture of everything you have published over a chosen period. We will show you how to run one with Popsters and turn the results into concrete ideas for your content plan.
What is a content audit?
A content audit is a review of all the posts published on a social network over a chosen period, where you look at and analyze what resonated with your audience and what went unnoticed. It is essentially an inventory of your published material, which helps you understand where you stand and plan the direction of your further development.

An audit usually answers a few simple questions:
- Which posts and topics get the most reactions?
- Which format works best: video, carousel, or text?
- At what time is your audience most responsive to your posts?
It is also useful to see how your content differs from what your competitors are doing and which topics your plan is still missing.
Doing all this by hand takes a long time, so it makes sense to hand the work over to an analytics service such as Popsters, where you can collect a page's activity statistics in a couple of minutes and see which posts worked and which did not.
Step-by-step guide
Before you start collecting data, define the goal of your audit and think about what exactly you want to find out:
- Awareness and reach. Look at views and follower growth.
- Audience engagement. Look at ER, ERview, comments, and reposts.
- Website visits and leads. Engagement alone is not enough here, because a high ER does not guarantee that a person clicked the link or made a purchase.
Popsters statistics show how the audience reacted to your posts, but not what people did after clicking. To connect your content with results, add UTM tags to the links in your posts and track visits and conversions in your analytics systems. That way, the conclusions of your audit will let you compare which posts collect reactions and which ones bring people to your website.
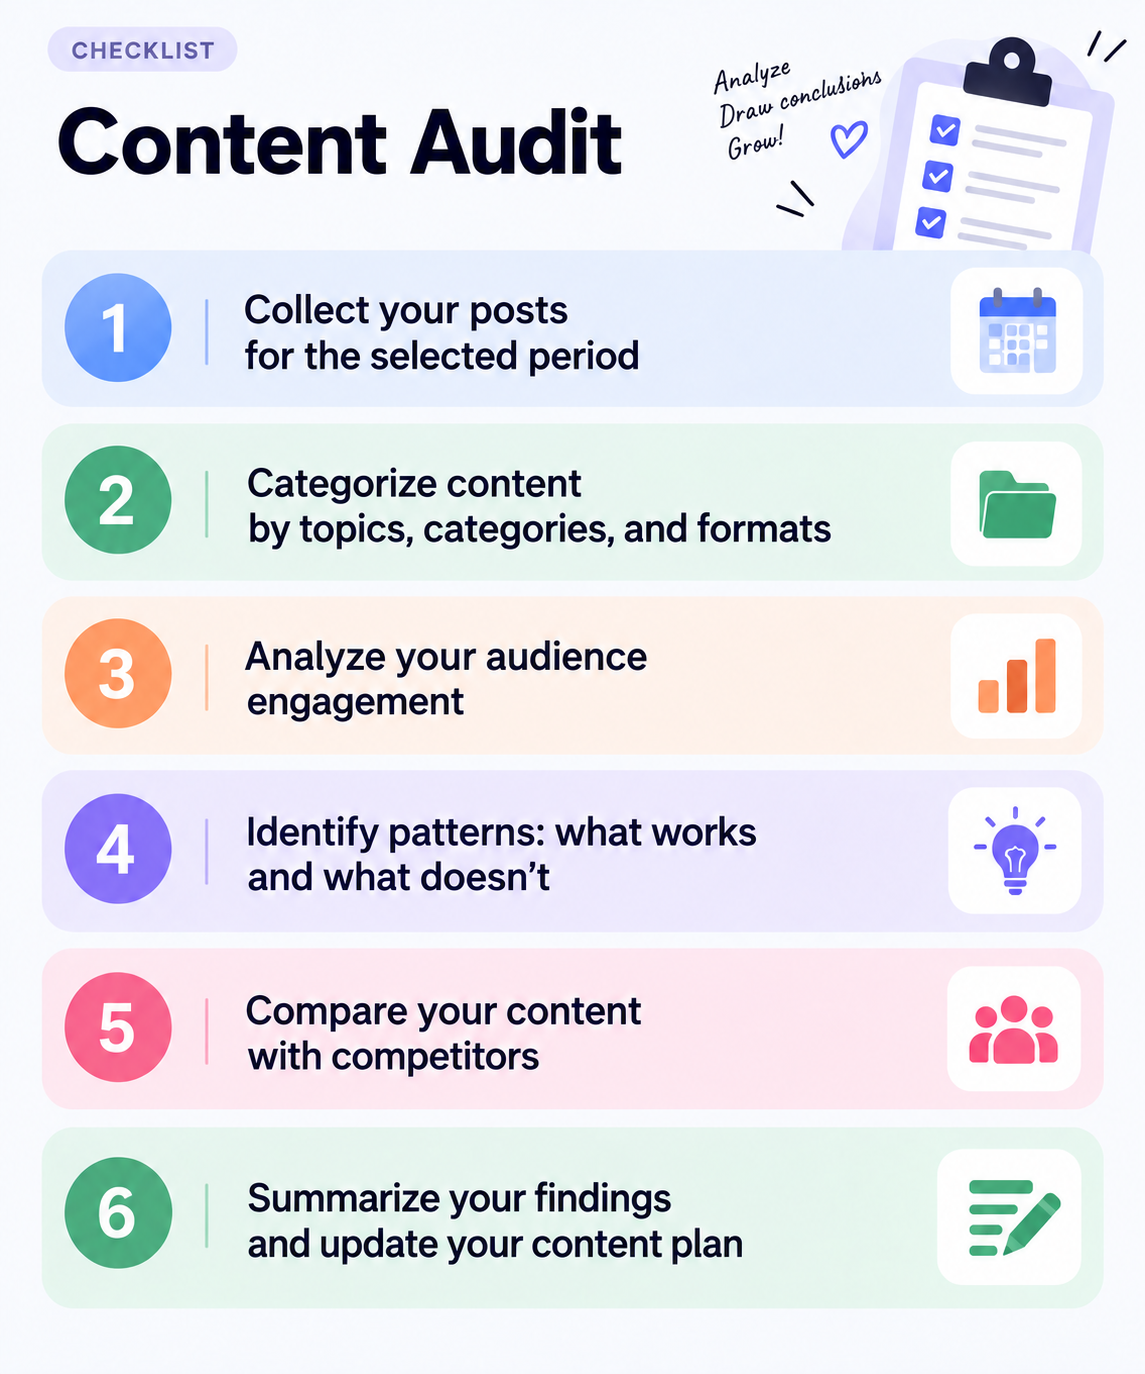
Step 1. Collect your posts for the period
Define the audit period for which you want to analyze your posts. It is best to choose a period of at least two months to get a more objective picture: a period that is too short will not reveal any patterns, while one that is too long will blur the overall dynamics with outdated data.
If you run accounts on several social networks at once, you can also upload all of them to Popsters at the same time and compare which networks get more activity on the same topic and which get less.
You will need to tag the topics of your posts yourself. When comparing results across platforms, keep in mind that the set of metrics differs between social networks (for example, views are not available everywhere), so ER and ERview can only be compared approximately between platforms.
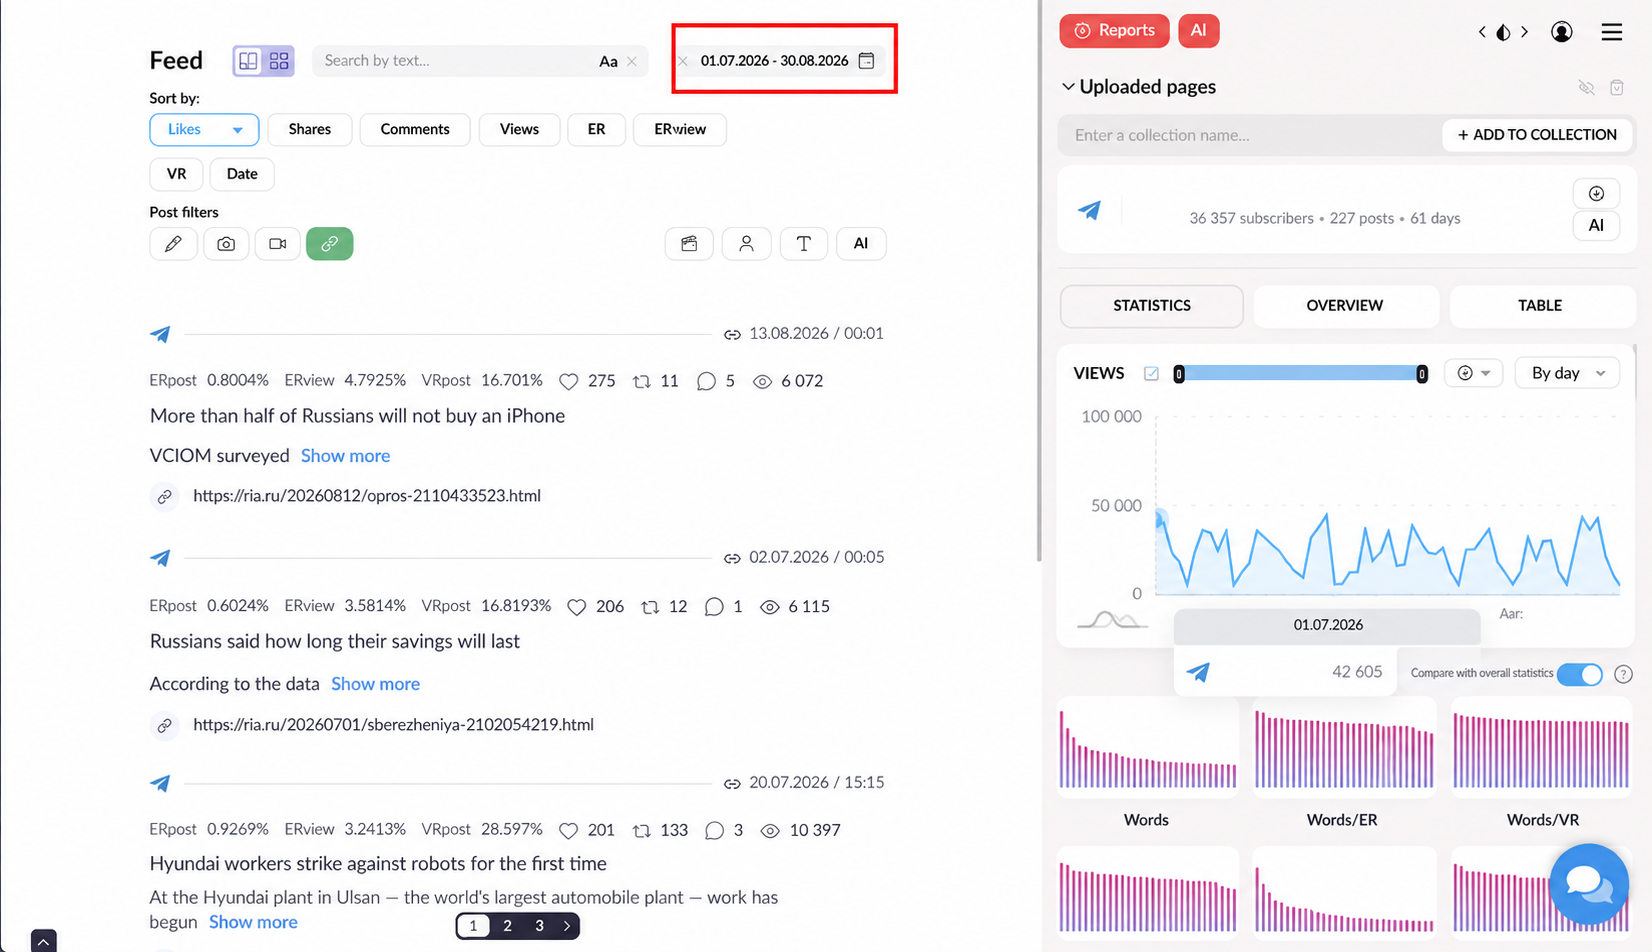
*Select the period for analyzing your posts
Step 2. Break your content down by topic, category, and format
Analyze all the collected posts and group them by topic, category, and format. This shows what your published content actually consists of and how closely it matches your plan.
- Check the big picture. The "Overview" block shows the number of posts for the selected period and their average metrics. Compare your actual posting frequency with your content plan.
- Compare post formats. Above the feed there are filters by post type. Turn them on one by one and see how many posts fall into each format and what their activity metrics are.
- Export the data to tag topics and categories. Popsters does not detect topics and categories automatically, so you will need to do this part yourself. The easiest way is to work with an export of your posts in a spreadsheet, where you can add your own categories and assign each post to one.
- Quick analysis in the AI section. You can pass the report for the selected period to an AI assistant. You will find this feature in the AI section: just generate a report and send the link to it together with your request.
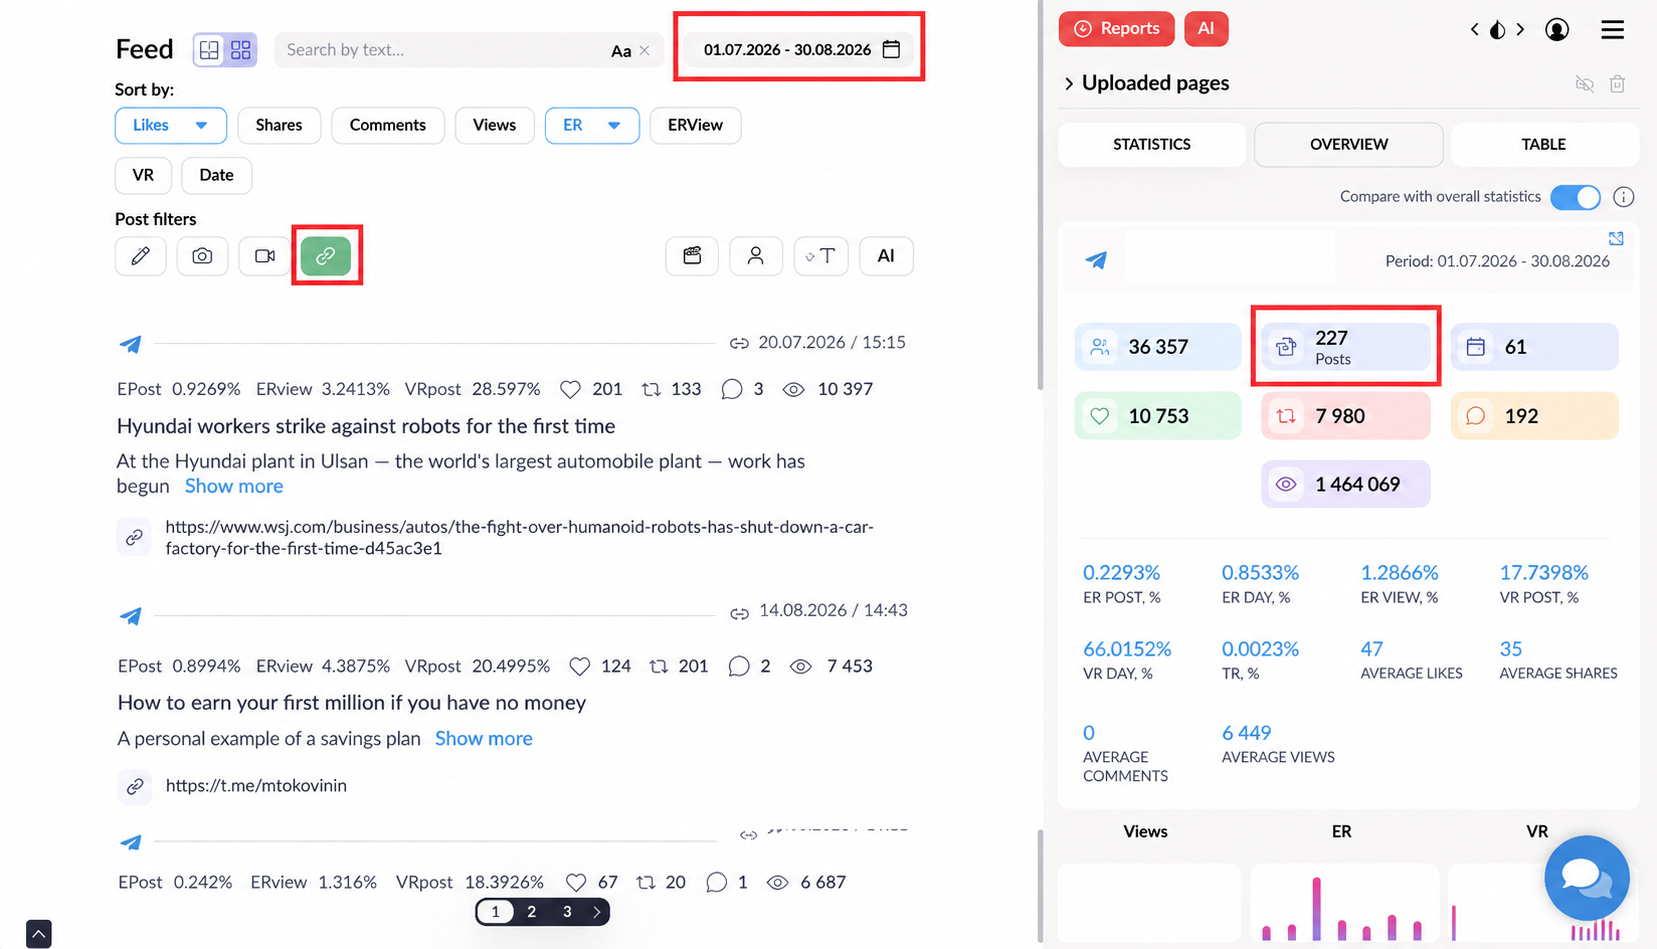
*Filters by post type and the total number of posts for the period
Step 3. Analyze audience activity
Compare your posts by engagement rate (ER), which is the ratio of all interactions to the number of followers, and then find your most and least successful posts.
If the social network provides view data, you can also use ERview. This metric takes the number of views into account and helps you estimate how many interactions a post received relative to the number of people who actually viewed it.
Instead of calculating the metrics for each post by hand, it is easier to analyze them in Popsters. The service automatically calculates ER and ERview wherever view data is available and lets you quickly compare the results of your posts.
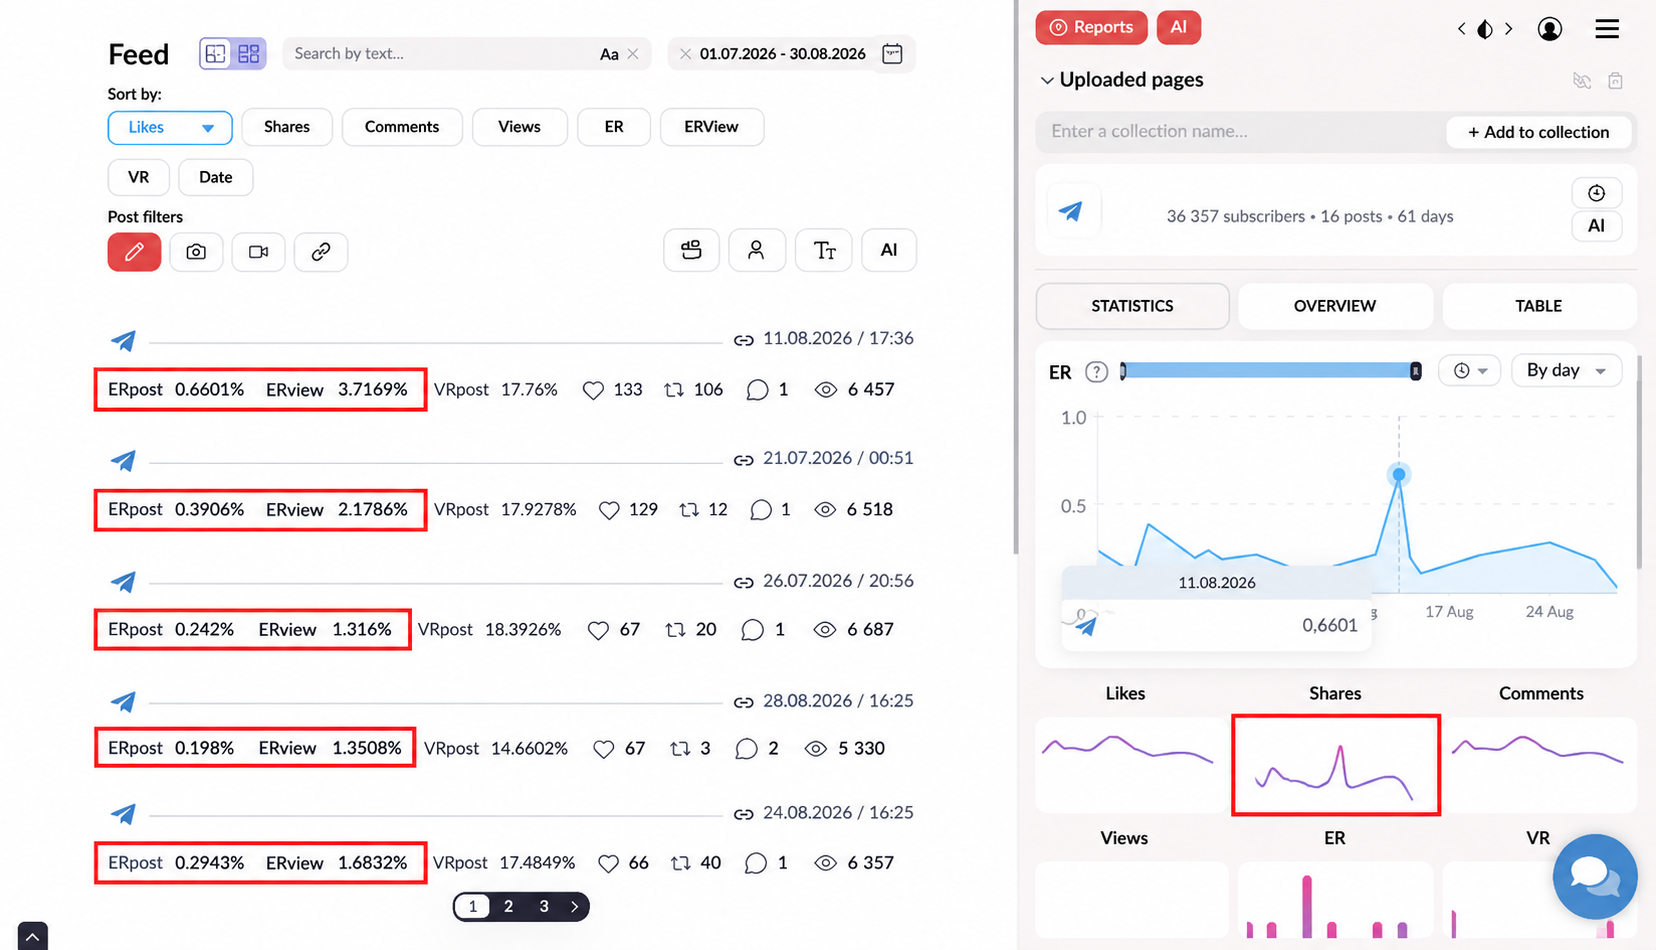
*Compare ER and ERview across different posts
To tell whether a value is high or low, compare a post's metrics with the page averages in the "Overview" block, and sort the feed with the buttons above it, choosing the metric that matches your audit goal.
Step 4. Find patterns: what works and what doesn't
Compare your most and least successful posts and try to work out what may have influenced their results. Pay attention to topics, formats, text length, presentation style, and other features of the content. If your successful posts resemble each other, determine what exactly they have in common and check whether the same pattern repeats in other posts.
In Popsters, you can see how post activity changes by day and hour and match this data against the content published during that period. This lets you check whether the differences in results are linked to publishing time, or whether topic, format, text length, and presentation style have a stronger effect.
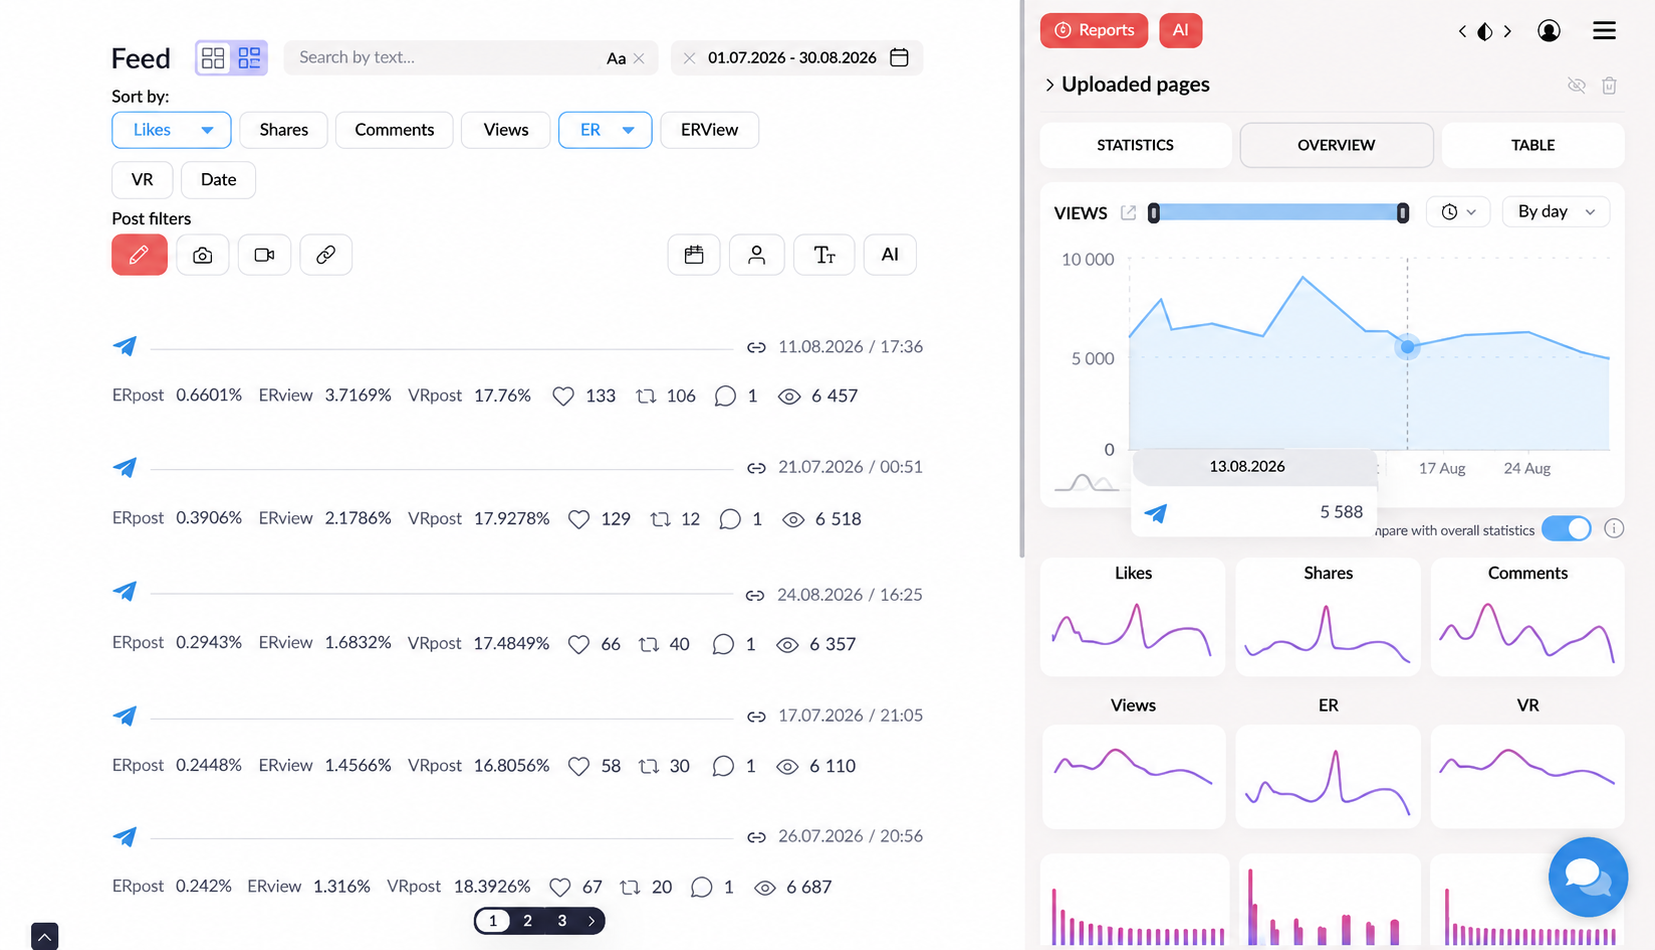
For example, on the chart you can see how views changed over the period, and in the feed you can compare this with the metrics of individual posts. This makes it easier to notice which posts got more activity and what may have influenced their results.
Step 5. Compare your content with competitors
Auditing only your own page gives an incomplete picture, so comparing yourself with competitors helps you see how your results look against theirs. Pay attention to which topics and formats they use, which of their posts get more activity, and which ideas you could test on your own page.
Popsters lets you analyze up to 10 pages at once and compare them by overall metrics and post activity.
Once the pages are loaded, compare them on a single chart. For example, a daily ER chart shows how the engagement of two pages changed over the period: if you hover over any date, Popsters shows the values of both pages for that day. Look not only at whose metric is higher but also at the shape of the line: sharp peaks point to individual successful posts, while a steady line without dips means a stable audience response.
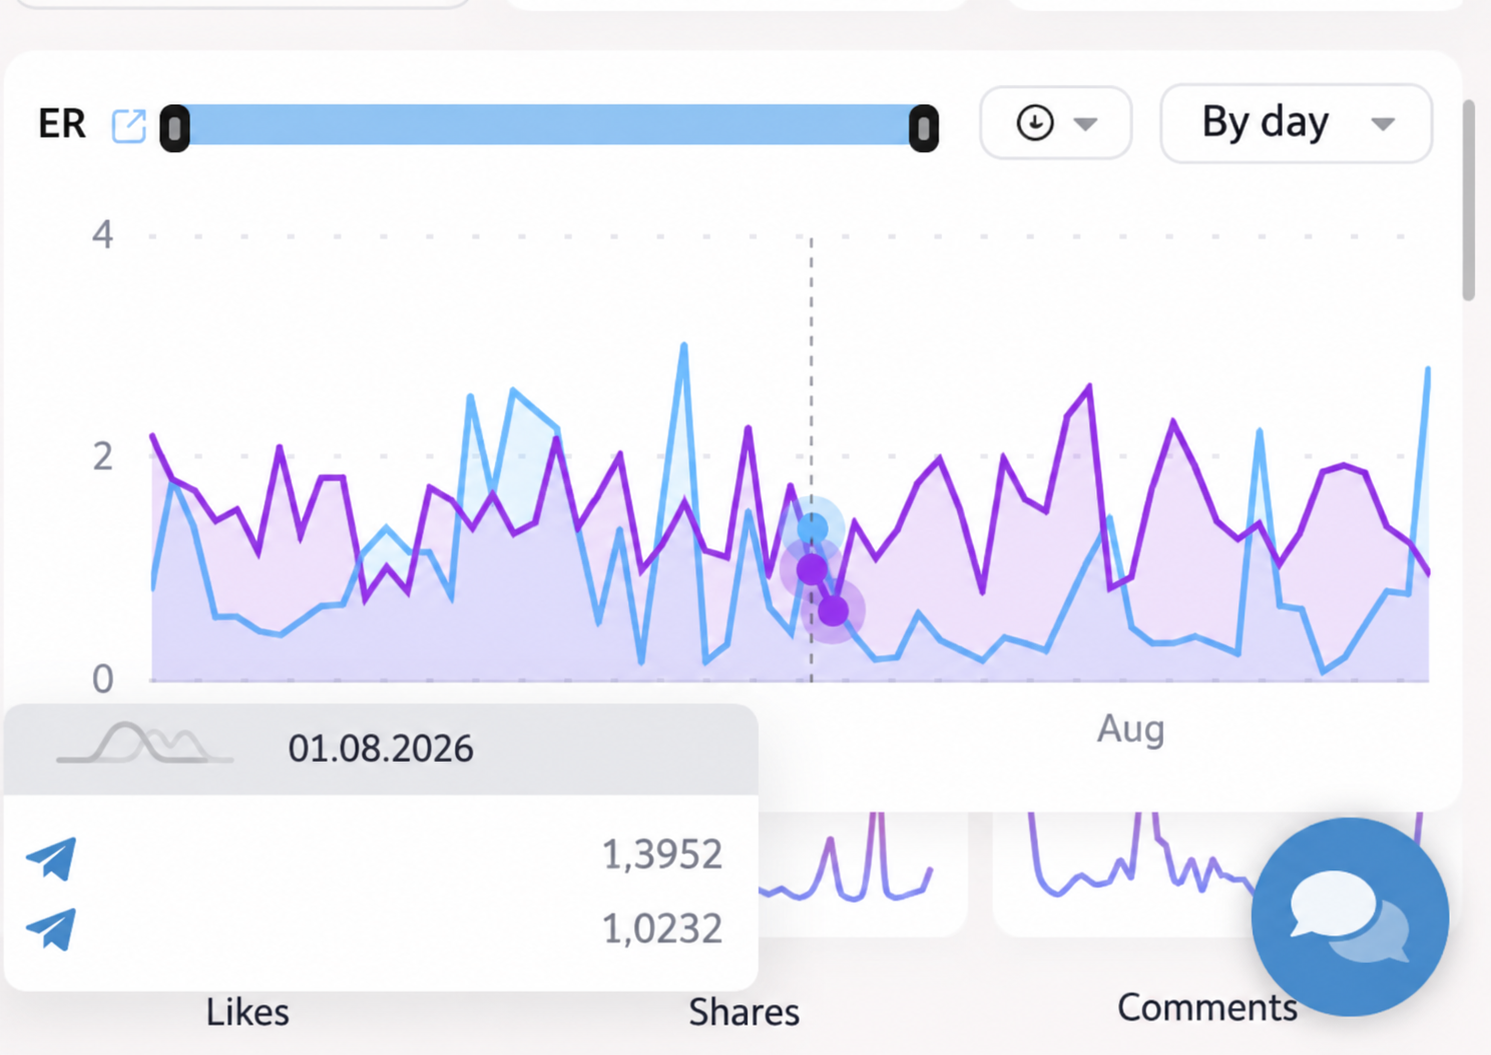
*Daily ER comparison of two pages
Step 6. Draw conclusions and update your content plan
Turn the results of your analysis into concrete decisions: which topics and formats to use more often, what to add or remove, and which new ideas to test. For example, if expert posts get twice as many reposts or comments as entertainment posts, you can increase their share in your content plan.
A content audit is not a one-time exercise, so it makes sense to come back to it every few months. This way you can track changes in your audience's preferences and adjust your content plan in time.
Conclusion
A content audit helps you see the big picture behind individual posts and understand what really works and what does not deliver the results you expect. Instead of collecting and comparing data by hand, you can automate this work with Popsters, which helps you calculate engagement, compare pages, and find posts with different levels of activity.
Want to test this on your own data? Try Popsters for free and run your first audit in a few minutes.

Try Popsters Trial plan to get content activity statistics of any pages for a next 7 days for free
Try for free
Popular
-
 Instagram Statistics and Analysis: How to View Data of any Account
-
 Analytics and Statistics for Any Telegram Channel or Chat
-
 How to Remove fake Followers on Instagram and Is It Necessary?
-
 YouTube Analytics and Statistics for Other Channels
-
 How to Increase Telegram Subscribers: Best Free Ways
Try Popsters Trial plan to get content activity statistics of any pages for a next 7 days for free
Try Popsters