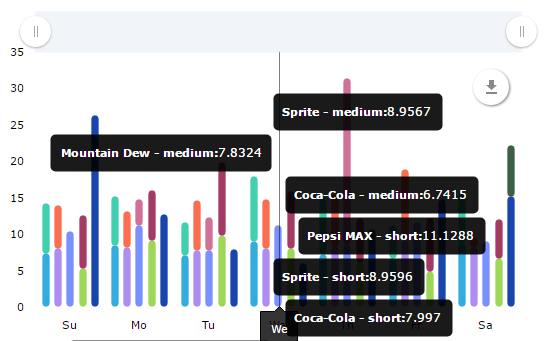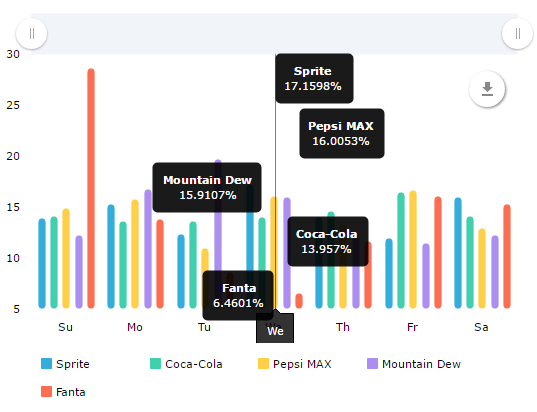
The chart shows the relative activity of an average post that have been published on a particular day of the week. This chart doesn’t display the count of published posts by days of the week. In reality, it shows the average activity of posts that were published on different days of the week, comparing to the post made on other days. Data is given in percent (%) using information for the whole analyzed period.
To calculate the relative activity by the days of the week, the tool takes into all posts published on a particular day of the week, sums up all the activities for each day, then calculates the average count of engagement on these days and calculates their relative percentage.
For example If Mondays index is 15%, and for Wednesday it is 10%, an average post appearing on Monday was 1.5 times more popular than one published on Wednesday.
This index can be used for planning the best day for publishing of your posts / advertisements.