Statistics vs. Analytics: What’s the Difference and How to Use Them Effectively?

In today’s data-driven world, information is power. As the saying goes, “Knowledge is power,” but simply collecting data is not enough—you must analyze it correctly. Statistics is the science of gathering, processing, and presenting data, whereas analytics takes it a step further by identifying patterns, drawing conclusions, and enabling informed decision-making.
In this article, we’ll explore how statistics and analytics are applied across different industries, examine their differences, and look at real-world examples of how companies use statistics to assess current conditions and analytics to predict trends and optimize strategies.
Statistics vs. Analytics: What’s the Difference?
Statistics and analytics are closely related but distinct concepts. Statistics is a tool for collecting, processing, and presenting numerical data to identify patterns and facts. Analytics, on the other hand, goes beyond just organizing data—it transforms it into actionable insights that drive decision-making.
Think of it this way: statistics is like an X-ray, revealing a problem, while analytics is like a doctor, diagnosing the issue and determining the best course of action. Simply put, statistics provides facts, while analytics interprets them and suggests next steps.
How Statistics and Analytics Are Used Today
SEO Optimization

A great modern example is the use of Google Analytics and Google Search Console to track user behavior on websites and evaluate keyword performance. SEO specialists analyze statistics related to metrics such as site visits, traffic sources, and keyword rankings in search engines.
Analytics helps identify which website pages generate high traffic and which ones underperform. For example, if statistics show a high bounce rate on a particular page, analytics helps determine the root cause—whether it's poor content quality or slow page load time. Additionally, analytics helps pinpoint which pages drive the most conversions (such as sign-ups or purchases), allowing businesses to refine and promote them further.
Moreover, statistics provide insights into user behavior across different devices (mobile, tablet, desktop), helping businesses optimize their websites for various platforms. Keyword analytics is also crucial in tracking which search terms bring in the most traffic and conversions, enabling better content strategies and on-site SEO improvements. By leveraging both statistics and analytics, SEO specialists can refine their website strategies, improve rankings, and boost organic traffic.
Medicine

One of the most striking examples of the power of statistics and analytics is the COVID-19 pandemic in 2019–2020. Doctors in Wuhan, China, were the first to notice a sharp increase in patients with similar symptoms—high fever, cough, and difficulty breathing.
Ongoing statistical monitoring played a crucial role in helping countries implement quarantine measures and predict the strain on healthcare systems. For instance, epidemiological forecasting models allowed governments to anticipate when hospitals would face shortages of beds and ventilators. Moreover, statistics were vital in vaccine development—by analyzing clinical trial data, scientists were able to determine the safety and effectiveness of vaccines before they were widely distributed.
Education

Universities rely on statistics to analyze student performance across courses. If average grades start to decline, analytics helps uncover the underlying causes. Additionally, universities use analytics to predict students' chances of passing final exams based on their academic performance throughout the course. This enables institutions to provide personalized learning approaches and targeted support, increasing student success rates.
Sports
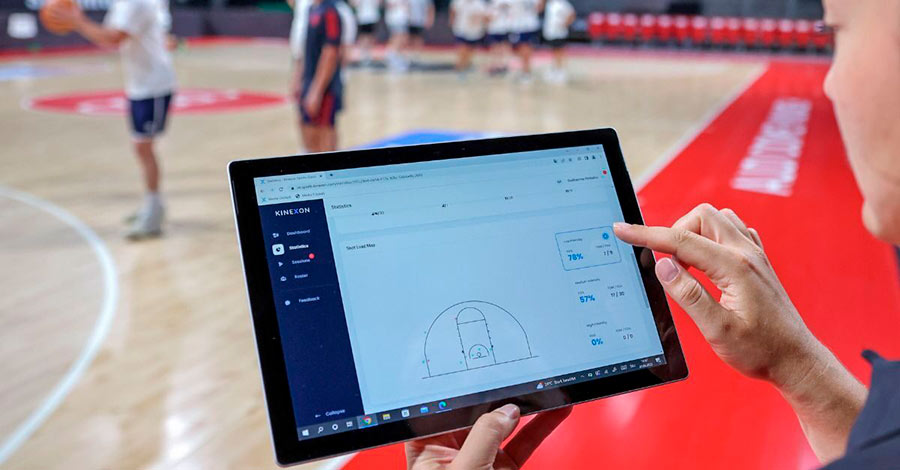
Professional sports, including leagues like the NBA and NFL, leverage vast amounts of data to analyze player performance. Advanced motion-tracking technologies, such as cameras and sensors, collect real-time data on every aspect of a player's movement, including speed, angles, number of shots, and even heart rate. This data helps coaches and analysts identify strengths and weaknesses, optimize training programs, and refine game strategies. Here are some interesting sports use cases, which you can adapt to your goals.
Beyond individual performance, statistics play a key role in tactical analysis during matches. In soccer, for example, teams analyze passing accuracy, player positioning, offensive and defensive efficiency to make strategic adjustments in real time. Big data and analytics also help predict match outcomes and assess injury risks, influencing long-term team strategies for the season.
Business

A prime example of successful data-driven decision-making is Netflix.
The company collects vast amounts of data on user behavior—when they start or stop watching, their genre preferences, and ratings of movies or shows. By leveraging analytics, Netflix identifies individual viewing patterns to recommend personalized content, significantly improving user engagement and retention.
Moreover, analytics helps Netflix make strategic decisions about content creation. By analyzing which genres and themes resonate most with viewers, the company invests in original productions that are likely to attract a wide audience. As a result, Netflix has strengthened its market position, increased customer loyalty, and built a highly successful data-driven content production model.
Key Data Sources and Tools Across Different Fields

Thanks to its flexibility, powerful libraries, and seamless integration with other systems, Python has become an essential tool for data analysis in medicine. This programming language is widely used for statistical analysis, machine learning, medical image processing, and patient data analysis. Key Python libraries for data analytics include Pandas, SciPy, and NumPy. NumPy is commonly used for scientific computing, while SciPy extends its functionality with more advanced mathematical tools. Pandas simplifies working with tabular data, such as CSV and Excel files, making data manipulation more efficient.
One of the most reliable sources of medical statistics is the World Health Organization (who.int). To ensure the most accurate data, WHO collaborates with various international organizations, each contributing to different aspects of health monitoring. For instance:
- The International Federation of Red Cross and Red Crescent Societies provides data on emergencies and disasters.
- UNICEF covers issues related to water supply and sanitation.
- The International Labour Organization (ILO) gathers data on occupational diseases.
- WHO also works with The International Atomic Energy Agency (IAEA) to assess the impact of radiation exposure on health.
Business Analytics and Market Research
In business, one of the most powerful data analytics and visualization tools is Power BI. Developed by Microsoft, Power BI is designed for reporting and analyzing key business metrics. It is widely used in financial analysis, budgeting, marketing analytics, sales performance evaluation, customer behavior analysis, inventory management, and logistics. Additionally, Power BI integrates AI and machine learning tools, helping businesses analyze trends and forecast future performance, making it a valuable business intelligence platform.
A crucial source of market and consumer trend statistics is Statista (statista.com). The platform provides real-time data updates, covers over 170 industries, and sources information from government agencies, research institutions, and corporate reports. For example, if a company is planning to expand into a new market in Europe, Statista can provide consumer preference reports, competitor sales statistics, market growth forecasts, and key industry trends. This data enables companies to develop an effective expansion strategy based on accurate insights.
Education and Data Collection Tools
One of the most widely used free tools for surveys and data collection in education is Google Forms. It allows users to create surveys, quizzes, and feedback forms, making it an essential tool for teachers, students, and school administrators. Key advantages include:
- Ease of use – intuitive interface for quick form creation.
- Automatic data collection in Google Sheets for easy analysis.
- Interactive quizzes with auto-grading to assess students’ knowledge.
- Integration with Google Classroom for seamless assignment management.
- Cross-device accessibility, allowing surveys to be taken from any device.
Google Forms is widely used for testing student knowledge, collecting homework, measuring attendance, and conducting school-wide surveys. Researchers also use it to analyze educational quality and social factors affecting learning outcomes.
A leading global organization for education statistics is UNESCO (uis.unesco.org). Its database contains key information on literacy rates, school enrollment, the number of schools and students, and access to education. UNESCO also provides insights into gender disparities, education in developing countries, and school funding. Additionally, the organization monitors digital transformation in education and the adoption of online learning. These insights are crucial for analysts, researchers, and policymakers developing education strategies and are presented in reports, infographics, and interactive dashboards for easy analysis.
Conclusion
Statistics and analytics play a vital role in today’s world, providing valuable information for data-driven decision-making. While statistics lay the foundation for analysis, analytics transform raw data into meaningful predictions and strategies. The combination of both allows companies, researchers, and institutions to optimize processes, enhance performance, and develop innovative solutions across various fields.
Useful article on a similar topic:
Try Popsters Trial plan to get content activity statistics of any pages for a next 7 days for free
Try for free
Popular
-
 How to Increase Telegram Subscribers: Best Free Ways
-
 Instagram Statistics and Analysis: How to View Data of any Account
-
 Analytics and Statistics for Any Telegram Channel or Chat
-
 YouTube Analytics and Statistics for Other Channels
-
 How to Remove fake Followers on Instagram and Is It Necessary?
Try Popsters Trial plan to get content activity statistics of any pages for a next 7 days for free
Try Popsters