5 Easy Steps to Increase Social Media Engagement Manyfold

There have been plenty of articles on how to attract target audience, but how to deal with that audience afterwards? What content (posts) should be published to increase social media engagement, for them to buy your products more frequently and to become loyal to the brand?
At the stage when a community already exists and the needed audience is attracted, many make a big mistake – they prepare materials and post what the subscribers might, in admin’s opinion, like within the context of the company’s targets: it may include jokes, branded puzzles, direct advertising describing the problems solved by the product, some “engaging” posts with open questions. No, there’s nothing bad about such posts, but what if the audience’s opinion differs from that of the admin? In that case, activity in the community would be sluggish, sales level low and, correspondingly, the budget spent ineffectively. There are two options how to solve this problem: try and suffer bumps and bruises or do a more reasonable thing – analyze what the audience likes, compare different mechanics, monitor competitors’ activities and only create your own content based on the analysis. The analysis will help to find materials that are objectively interesting for the audience and to avoid bias in planning.
To solve this problem, our team of several members created a social media content analysis tool– popsters.com. The tool will help to compare posts, view statistics, compare different communities between each other and even to assess performance of different subjects.
To make the working method development easier, we divided the solution process into steps:
Assess Post Popularity, Analyze Preferences of the Audience of Interest
This will require the tool’s post loading and sorting functionality – the very basic functionality, on which following steps will be based. The tool loads all the community’s posts over the specified period and shows them as feed sorted by activity types: likes, shares, comments, ER (we will return to it in detail), date, and views for social media with videos.
Divide the assessment in two stages: analyze what the audience likes and see what competitors do.
To understand what attracts our target audience, pick communities with the largest number of its representatives. It can be done in two ways: the first way is to pick by yourself based on the required subject (e.g., if your clients are parents, take mothers’ communities), the second way is to select using specialized services, e.g. people4u.ru where you can specify your TA’s parameters: age, location, etc. and obtain the list of suitable VK pages. The advantage of the first way is that you’ll get content that is the closest to your subject, while in the second case the majority of communities with required audience might be not in a group dedicated to the subject.
Now we proceed directly to analysis itself – load and sort posts of selected competitor communities and pages, see which posts engaged the audience to better activity (better to sort by ER – this parameter takes into account all the possible activity characteristics) and which posts engaged worse (double-clicking the sorting button will change the order). The most popular posts may be saved to Favorites to return to them later (to analyze and increase engagement in your social media community), and the most unpopular posts may be taken as an example of “doing it wrong”.
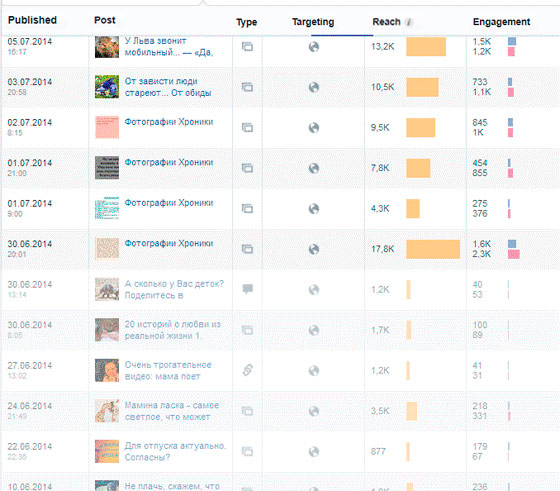
This step suits to not only company communities but also to entertainment communities. For example, one of Websarafan’s authors, Andriy Zyuzikov, tested what would happen if you find, using Popsters, the most popular posts in other communities and repost them on the page you moderate.
Andriy started testing from the post published on June, 30 at 8:01 p.m. and, as you can see, the activity and reach indicators per post increased tenfold! However, this example is for an entertainment community and non-unique materials. You can achieve much more using the following steps.
Assess Popularity of Posts on Different Subjects and with Different Contents
The data on which post objectively gained more likes/shares/etc. in a community overall will turn out to be useless if posts on different subjects are published on the same page, since a particular post type or format may, in principle, attract more attention: contests, funny pics, etc. In this case, you can filter the feed in Popsters to leave only posts with a particular content type: pictures, videos, links, texts, hashtags, etc.
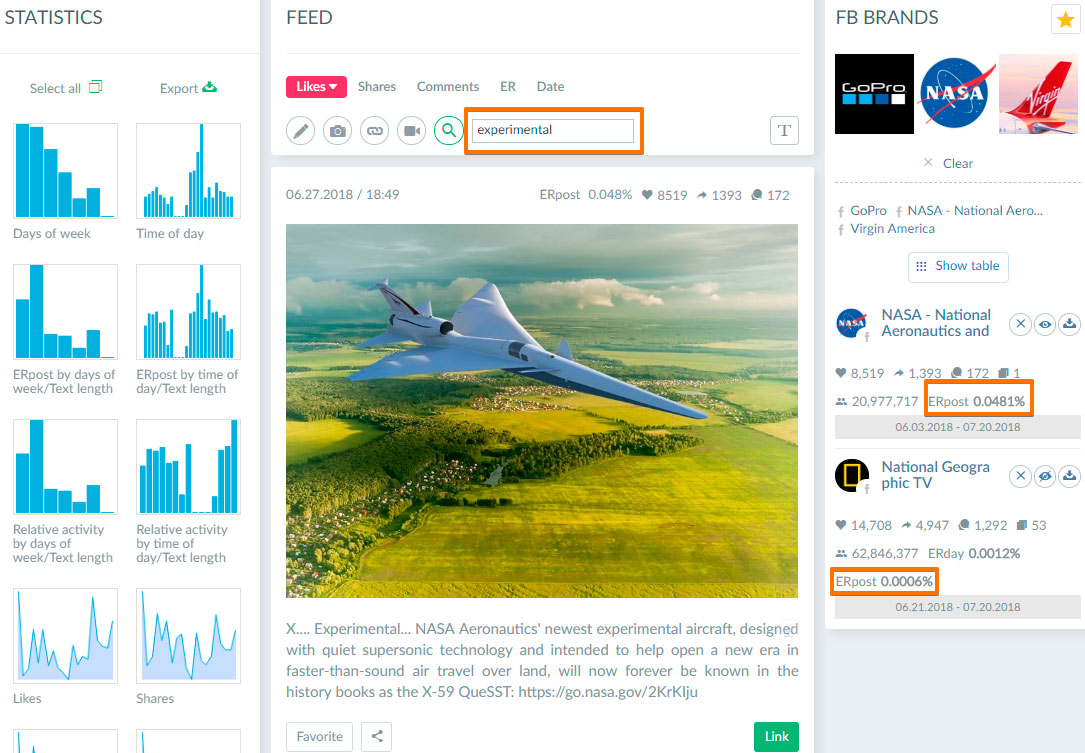
The filter panel is directly under the sorting buttons – these are buttons to filter by content type (video/photo/etc.) and Text Referencing and Search buttons.
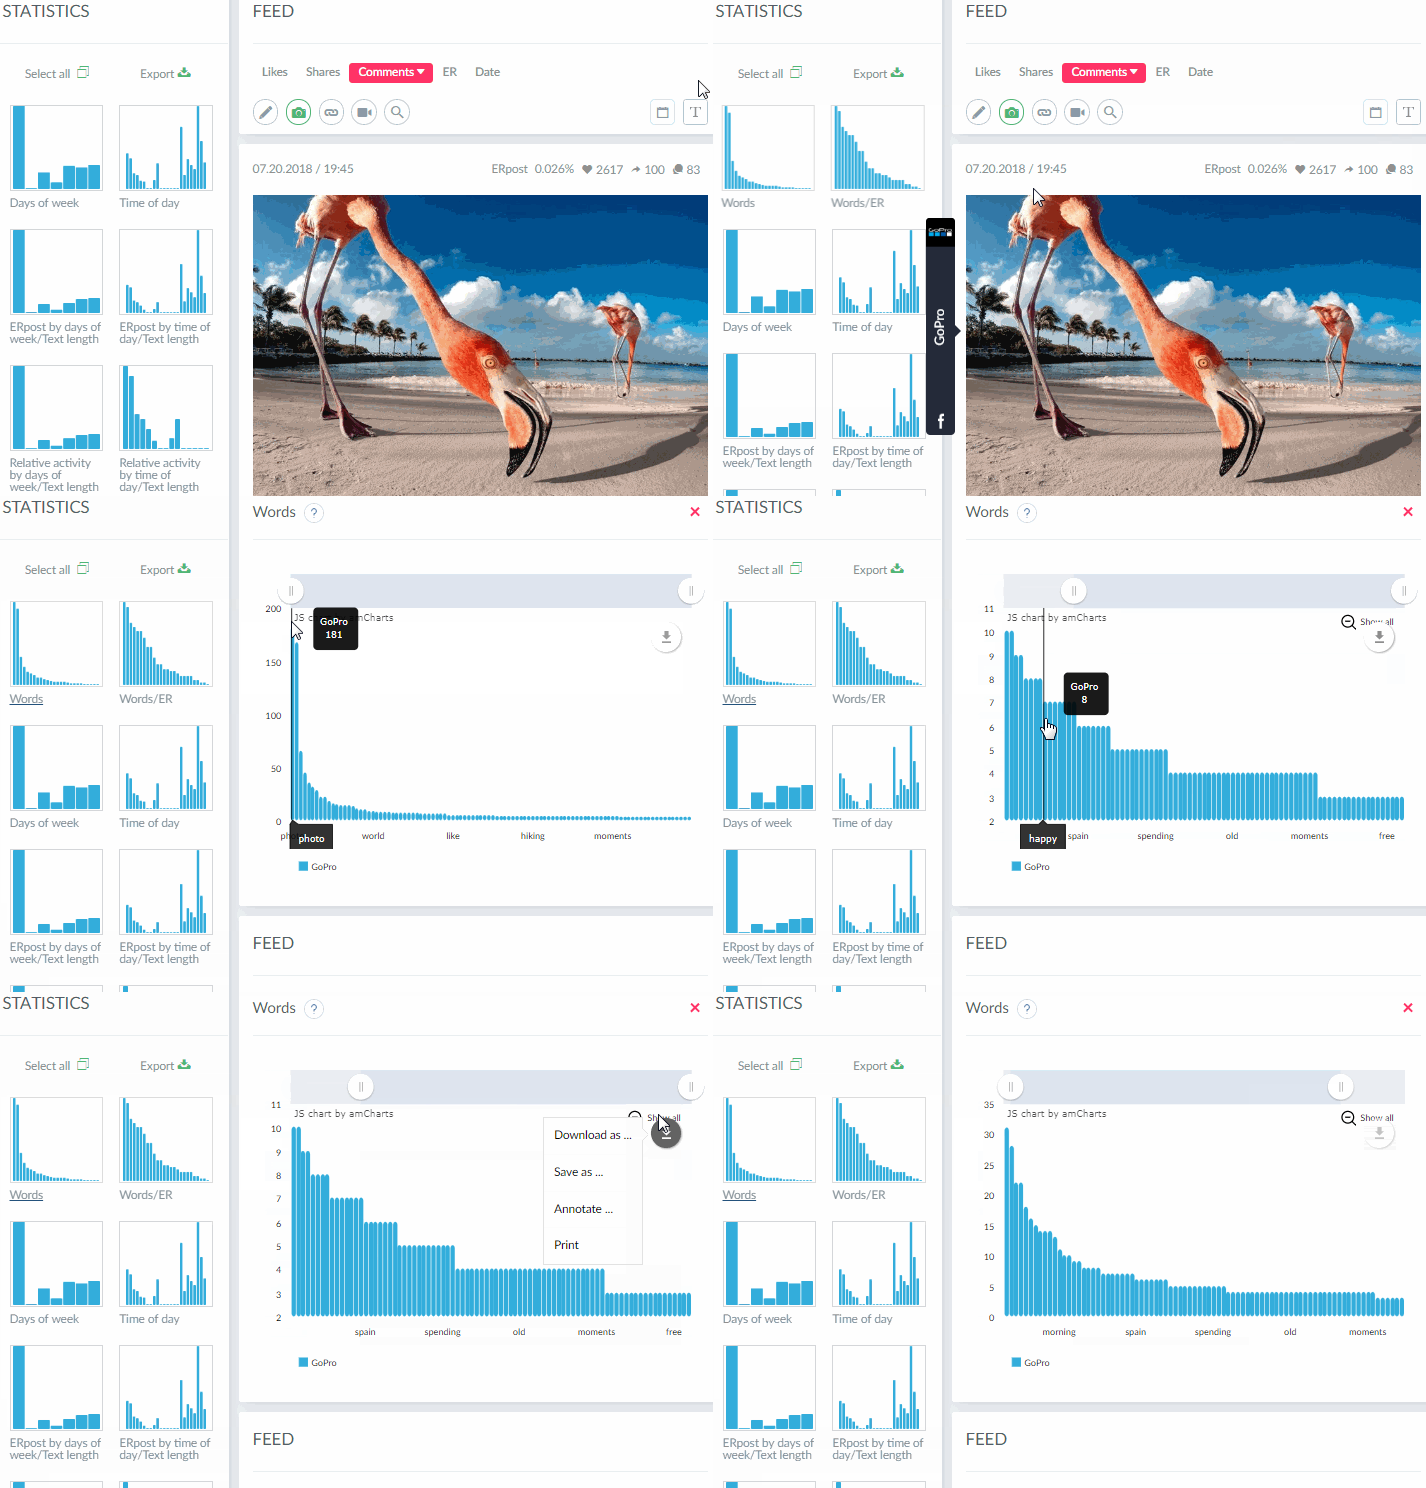
If you click Text Referencing, the tool will count all the hashtags and the most frequently used words and output the number of posts containing them and the total number of mentions. If you click on any word or hashtag, the feed will be filtered to leave only relevant posts.
So now, if you need to find popular posts with particular content type, filter the posts and then compare posts between each other within any particular filter. Thus, you can see, for example, which posts with links were more popular in competitor communities, which contests were more active, or which post containing the word “sport” provoked more parents’ emotions. Having the data on which posts in particular sections work better or worse, you can better segment tasks and prepare posts in different formats within your own community.
Another useful feature: If you load several different communities one after another, enable the display of previously loaded ones (in Loaded Pages, click the icon of an eye with a line through it – what was previously loaded is automatically hidden after you try to load a new page), and only then do Referencing; popular words and hashtags will be collected over all the communities in the feed at the same time and you’ll be able to compare posts from different communities with similar format/content.
Using the social media content analytics tool, you can understand your audience better. This will improve the content strategy in social networks and significantly increase the involvement of subscribers and reach.
Create Subject Index and Assess Its Efficiency
Your company’s field of activities most probably allows using not only same-type posts about your product. Efficient content marketing usually implies dividing posts into different subjects: product information, fun, interesting facts, ads and any other. A common situation is when subjects are selected relying upon the author’s creativity. What’s easier and more efficient is to analyze and compare performances of different subjects of competitors, thematic communities or old posts on your page, take those performing best and work them through.
As already mentioned previously, ER (engagement rate) is one of the most convenient indicators. ER shows the audience’s engagement. In broad terms, it shows the portion of subscribers being active. It accounts for the number of likes, comments, shares and subscribers. The classic formula by SocialBakers (one of major international players in social media analytics) only involves average ER calculation per day, i.e. what percentage of the audience showed activity in the community over a particular day, less regard to how many posts were published during that time. We, in turn, added an additional indicator – ER per post that allows comparing engagement between posts.
One of the tool’s functions is to recalculate all the total and average values in Loaded Pages section. When any filter is applied, average ER is recalculated for all the posts filtered. This allows seeing how ERpost changes depending on selected subject filter. Its value will be higher for better performing post subjects/formats. Thus, this step’s task is to do referencing (analysis) of the text and see which subjects perform better and which perform worse. In further planning, reject poorly performing subjects and focus on developing subjects that are more popular instead.
Based on the analysis, note the subjects (btw, subjects are often marked with a specific hashtag, which facilitates analysis and navigation) showing highest performance and add subjects that do not cause low indicators. For example, the subject index for a dental clinic might include the following post formats: informative (telling about a service or technology), client experience (feedback from satisfied customers, photos), motivational (stories/quotes of notable people with beautiful teeth), funny. Five to six different subjects would be enough for your further work.
Behavioral Psychology and Calculation of Suitable Time to Post
Right time to post is also a very important issue. It’s not enough here to rely on massive studies and supposed “good” timing – every individual audience behaves differently, therefore take into account two factors, psychological and statistical, to approximately choose appropriate hours and days for posting.
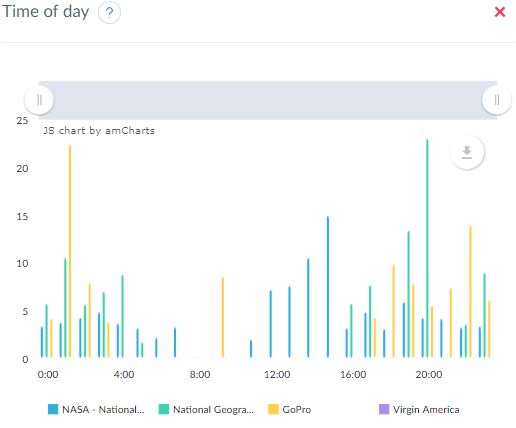
The tool has a function of automatic calculation of average activity for a particular time and weekday – there are two diagrams for it in Diagrams section at the very top. The data are calculated over the entire period, over which the community is analyzed, i.e. if a community is loaded over a month, the data will be average for all the posts for that month, if it is loaded over a year – for the entire year.
To have the most objective group statistics data, load several thematic/competitor communities and your own community for the same objective period (better within 30 days, user online behavior may vary in different months), then go to Diagrams and see what time shows the highest average activity for all the loaded pages. This will provide understanding of the statistical situation.
It is important to account for the psychological factor in behavior: What your target audience may do at the statistically active time. If your audience is university students and today is Friday, it is advisable not to publish long texts at 8 p.m., since Friday is traditionally the party day and students going online usually don’t stay long, they quickly scroll the feed and exit. If your TA is mothers, posting on Friday night may be more effective, as mothers may stay home and look after their kids.
Prepare Content
Now, when you have data on what posts perform better or worse, you know what competitors use, you have selected subjects that perform best and chosen the time to post, you may proceed to preparing posts themselves. It is an important step to increase activity and social media engagement for any community.
This step’s task is to combine the obtained data with the information your company wants to bring to the audience’s attention. Use effective posts as an example, pick materials in similar formats or subjects and convert them into your own post to achieve two goals at the same time – show interesting content to the audience and bring to the audience’s attention what your company wants to bring.
Using the mentioned methods in your work, you can significantly improve the community’s performance, increase activity in the group, the engagement level, traffic generated to the site and, as a consequence, growth in your product sales. The basis for analysis may be another social network – being guided by activity in Instagram, you can adapt some mechanics to VK or Facebook. To enable that, Popsters supports analysis for 10 social media: Instagram, Facebook, YouTube, Twitter, Telegram, Tumblr, Pinterest, VK, OK.RU, Google +, Flickr, and Coub.
Useful articles on a similar topic:
- The 5 Best Alternatives to Instagress that Will Not Fail You;
- The guide to creating great captions on Instagram;
- How to create Social Media Reports with awesome quality more quickly;
- A large study about Activity on Social Media - based on data of 460 million posts.
Try Popsters Trial plan to get content activity statistics of any pages for a next 7 days for free
Try for free


